from_dual#
- classmethod ShortTimeFFT.from_dual(dual_win, hop, fs, *, fft_mode='onesided', mfft=None, scale_to=None, phase_shift=0)[source]#
Instantiate a
ShortTimeFFTby only providing a dual window.If an STFT is invertible, it is possible to calculate the window
winfrom a given dual windowdual_win. All other parameters have the same meaning as in the initializer ofShortTimeFFT.As explained in the Short-Time Fourier Transform section of the SciPy User Guide, an invertible STFT can be interpreted as series expansion of time-shifted and frequency modulated dual windows. E.g., the series coefficient S[q,p] belongs to the term, which shifted
dual_winby p *delta_tand multiplied it by exp( 2 * j * pi * t * q *delta_f).See also
from_windowCreate instance by wrapping
get_window.ShortTimeFFTCreate instance using standard initializer.
Examples
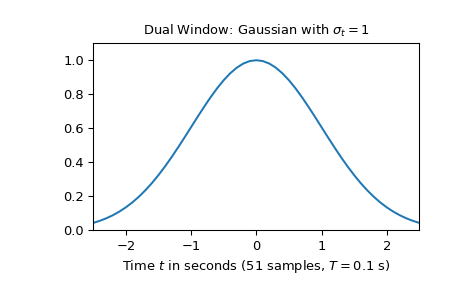
The following example discusses decomposing a signal into time- and frequency-shifted Gaussians. A Gaussian with standard deviation of one made up of 51 samples will be used:
>>> import numpy as np
>>> import matplotlib.pyplot as plt
>>> from scipy.signal import ShortTimeFFT
>>> from scipy.signal.windows import gaussian
...
>>> T, N = 0.1, 51
>>> d_win = gaussian(N, std=1/T, sym=True)  # symmetric Gaussian window
>>> t = T * (np.arange(N) - N//2)
...
>>> fg1, ax1 = plt.subplots()
>>> ax1.set_title(r"Dual Window: Gaussian with $\sigma_t=1$")
>>> ax1.set(xlabel=f"Time $t$ in seconds ({N} samples, $T={T}$ s)",
...        xlim=(t[0], t[-1]), ylim=(0, 1.1*np.max(d_win)))
>>> ax1.plot(t, d_win, 'C0-')
The following plot with the overlap of 41, 11 and 2 samples show how the
hopinterval affects the shape of the windowwin:>>> fig2, axx = plt.subplots(3, 1, sharex='all') ... >>> axx[0].set_title(r"Windows for hop$\in\{10, 40, 49\}$") >>> for c_, h_ in enumerate([10, 40, 49]): ... SFT = ShortTimeFFT.from_dual(d_win, h_, 1/T) ... axx[c_].plot(t + h_ * T, SFT.win, 'k--', alpha=.3, label=None) ... axx[c_].plot(t - h_ * T, SFT.win, 'k:', alpha=.3, label=None) ... axx[c_].plot(t, SFT.win, f'C{c_+1}', ... label=r"$\Delta t=%0.1f\,$s" % SFT.delta_t) ... axx[c_].set_ylim(0, 1.1*max(SFT.win)) ... axx[c_].legend(loc='center') >>> axx[-1].set(xlabel=f"Time $t$ in seconds ({N} samples, $T={T}$ s)", ... xlim=(t[0], t[-1])) >>> plt.show()
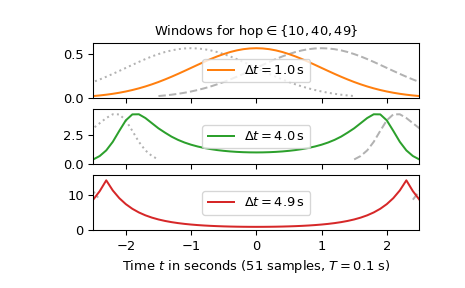
Beside the window
wincentered at t = 0 the previous (t = -delta_t) and following window (t =delta_t) are depicted. It can be seen that for smallhopintervals, the window is compact and smooth, having a good time-frequency concentration in the STFT. For the largehopinterval of 4.9 s, the window has small values around t = 0, which are not covered by the overlap of the adjacent windows, which could lead to numeric inaccuracies. Furthermore, the peaky shape at the beginning and the end of the window points to a higher bandwidth, resulting in a poorer time-frequency resolution of the STFT. Hence, the choice of thehopinterval will be a compromise between a time-frequency resolution and memory requirements demanded by smallhopsizes.