linregress#
- scipy.stats.linregress(x, y, alternative='two-sided', *, axis=0, nan_policy='propagate', keepdims=False)[source]#
Calculate a linear least-squares regression for two sets of measurements.
- Parameters:
- x, yarray_like
Two sets of measurements. Both arrays should have the same length N.
- alternative{‘two-sided’, ‘less’, ‘greater’}, optional
Defines the alternative hypothesis. Default is ‘two-sided’. The following options are available:
‘two-sided’: the slope of the regression line is nonzero
‘less’: the slope of the regression line is less than zero
‘greater’: the slope of the regression line is greater than zero
Added in version 1.7.0.
- axisint or None, default: 0
If an int, the axis of the input along which to compute the statistic. The statistic of each axis-slice (e.g. row) of the input will appear in a corresponding element of the output. If
None, the input will be raveled before computing the statistic.- nan_policy{‘propagate’, ‘omit’, ‘raise’}
Defines how to handle input NaNs.
propagate: if a NaN is present in the axis slice (e.g. row) along which the statistic is computed, the corresponding entry of the output will be NaN.omit: NaNs will be omitted when performing the calculation. If insufficient data remains in the axis slice along which the statistic is computed, the corresponding entry of the output will be NaN.raise: if a NaN is present, aValueErrorwill be raised.
- keepdimsbool, default: False
If this is set to True, the axes which are reduced are left in the result as dimensions with size one. With this option, the result will broadcast correctly against the input array.
- Returns:
- result
LinregressResultinstance The return value is an object with the following attributes:
- slopefloat
Slope of the regression line.
- interceptfloat
Intercept of the regression line.
- rvaluefloat
The Pearson correlation coefficient. The square of
rvalueis equal to the coefficient of determination.- pvaluefloat
The p-value for a hypothesis test whose null hypothesis is that the slope is zero, using Wald Test with t-distribution of the test statistic. See alternative above for alternative hypotheses.
- stderrfloat
Standard error of the estimated slope (gradient), under the assumption of residual normality.
- intercept_stderrfloat
Standard error of the estimated intercept, under the assumption of residual normality.
- result
See also
scipy.optimize.curve_fitUse non-linear least squares to fit a function to data.
scipy.optimize.leastsqMinimize the sum of squares of a set of equations.
Notes
For compatibility with older versions of SciPy, the return value acts like a
namedtupleof length 5, with fieldsslope,intercept,rvalue,pvalueandstderr, so one can continue to write:slope, intercept, r, p, se = linregress(x, y)
With that style, however, the standard error of the intercept is not available. To have access to all the computed values, including the standard error of the intercept, use the return value as an object with attributes, e.g.:
result = linregress(x, y)
print(result.intercept, result.intercept_stderr)
Beginning in SciPy 1.9,
np.matrixinputs (not recommended for new code) are converted tonp.ndarraybefore the calculation is performed. In this case, the output will be a scalar ornp.ndarrayof appropriate shape rather than a 2Dnp.matrix. Similarly, while masked elements of masked arrays are ignored, the output will be a scalar ornp.ndarrayrather than a masked array withmask=False.Array API Standard Support
linregresshas experimental support for Python Array API Standard compatible backends in addition to NumPy. Please consider testing these features by setting an environment variableSCIPY_ARRAY_API=1and providing CuPy, PyTorch, JAX, or Dask arrays as array arguments. The following combinations of backend and device (or other capability) are supported.Library
CPU
GPU
NumPy
✅
n/a
CuPy
n/a
✅
PyTorch
✅
⛔
JAX
✅
✅
Dask
⛔
n/a
linregressalso accepts MArrays backed by the backends indicated above; masked values will be treated as though they were not present.See Support for the array API standard for more information.
Examples
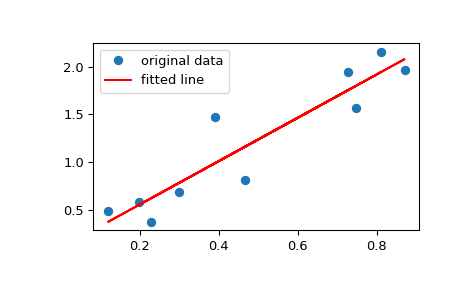
>>> import numpy as np
>>> import matplotlib.pyplot as plt
>>> from scipy import stats
>>> rng = np.random.default_rng()
Generate some data:
>>> x = rng.random(10)
>>> y = 1.6*x + rng.random(10)
Perform the linear regression:
>>> res = stats.linregress(x, y)
Coefficient of determination (R-squared):
>>> print(f"R-squared: {res.rvalue**2:.6f}")
R-squared: 0.717533
Plot the data along with the fitted line:
>>> plt.plot(x, y, 'o', label='original data')
>>> plt.plot(x, res.intercept + res.slope*x, 'r', label='fitted line')
>>> plt.legend()
>>> plt.show()
Calculate 95% confidence interval on slope and intercept:
>>> # Two-sided inverse Students t-distribution
>>> # p - probability, df - degrees of freedom
>>> from scipy.stats import t
>>> tinv = lambda p, df: abs(t.ppf(p/2, df))
>>> ts = tinv(0.05, len(x)-2)
>>> print(f"slope (95%): {res.slope:.6f} +/- {ts*res.stderr:.6f}")
slope (95%): 1.453392 +/- 0.743465
>>> print(f"intercept (95%): {res.intercept:.6f}"
...       f" +/- {ts*res.intercept_stderr:.6f}")
intercept (95%): 0.616950 +/- 0.544475