decimate#
- scipy.signal.decimate(x, q, n=None, ftype='iir', axis=-1, zero_phase=True)[source]#
Downsample the signal after applying an anti-aliasing filter.
By default, an order 8 Chebyshev type I filter is used. A 30 point FIR filter with Hamming window is used if ftype is ‘fir’.
- Parameters:
- xarray_like
The input signal made up of equidistant samples. If x is a multidimensional array, the parameter axis specifies the time axis.
- qint
The downsampling factor, which is a postive integer. When using IIR downsampling, it is recommended to call
decimatemultiple times for downsampling factors higher than 13.- nint, optional
The order of the filter (1 less than the length for ‘fir’). Defaults to 8 for ‘iir’ and 20 times the downsampling factor for ‘fir’.
- ftypestr {‘iir’, ‘fir’} or
dltiinstance, optional If ‘iir’ or ‘fir’, specifies the type of lowpass filter. If an instance of an
dltiobject, uses that object to filter before downsampling.- axisint, optional
The axis along which to decimate.
- zero_phasebool, optional
Prevent phase shift by filtering with
filtfiltinstead oflfilterwhen using an IIR filter, and shifting the outputs back by the filter’s group delay when using an FIR filter. The default value ofTrueis recommended, since a phase shift is generally not desired.Added in version 0.18.0.
- Returns:
- yndarray
The down-sampled signal.
See also
resampleResample up or down using the FFT method.
resample_polyResample using polyphase filtering and an FIR filter.
Notes
For non-integer downsampling factors,
resamplecan be used. Consult thescipy.interpolatemodule for methods of resampling signals with non-constant sampling intervals.The
zero_phasekeyword was added in 0.18.0. The possibility to use instances ofdltiasftypewas added in 0.18.0.Examples
>>> import numpy as np
>>> from scipy import signal
>>> import matplotlib.pyplot as plt
Define wave parameters.
>>> wave_duration = 3
>>> sample_rate = 100
>>> freq = 2
>>> q = 5
Calculate number of samples.
>>> samples = wave_duration*sample_rate
>>> samples_decimated = int(samples/q)
Create cosine wave.
>>> x = np.linspace(0, wave_duration, samples, endpoint=False)
>>> y = np.cos(x*np.pi*freq*2)
Decimate cosine wave.
>>> ydem = signal.decimate(y, q)
>>> xnew = np.linspace(0, wave_duration, samples_decimated, endpoint=False)
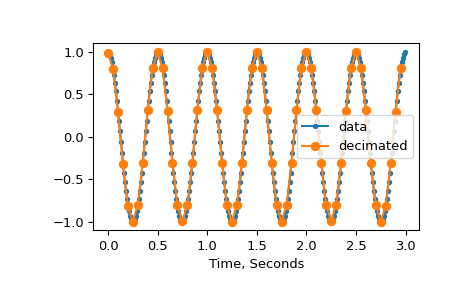
Plot original and decimated waves.
>>> plt.plot(x, y, '.-', xnew, ydem, 'o-')
>>> plt.xlabel('Time, Seconds')
>>> plt.legend(['data', 'decimated'], loc='best')
>>> plt.show()