scipy.stats.circmean#
- scipy.stats.circmean(samples, high=6.283185307179586, low=0, axis=None, nan_policy='propagate')[source]#
Compute the circular mean for samples in a range.
- Parameters:
- samplesarray_like
Input array.
- highfloat or int, optional
High boundary for the sample range. Default is
2*pi.- lowfloat or int, optional
Low boundary for the sample range. Default is 0.
- axisint, optional
Axis along which means are computed. The default is to compute the mean of the flattened array.
- nan_policy{‘propagate’, ‘raise’, ‘omit’}, optional
Defines how to handle when input contains nan. ‘propagate’ returns nan, ‘raise’ throws an error, ‘omit’ performs the calculations ignoring nan values. Default is ‘propagate’.
- Returns:
- circmeanfloat
Circular mean.
Examples
For simplicity, all angles are printed out in degrees.
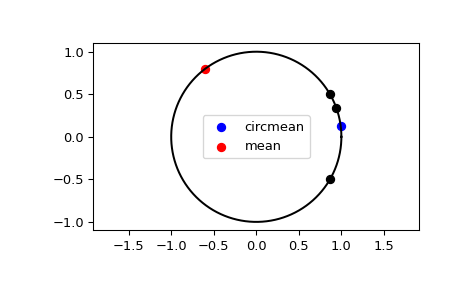
>>> import numpy as np
>>> from scipy.stats import circmean
>>> import matplotlib.pyplot as plt
>>> angles = np.deg2rad(np.array([20, 30, 330]))
>>> circmean = circmean(angles)
>>> np.rad2deg(circmean)
7.294976657784009
>>> mean = angles.mean()
>>> np.rad2deg(mean)
126.66666666666666
Plot and compare the circular mean against the arithmetic mean.
>>> plt.plot(np.cos(np.linspace(0, 2*np.pi, 500)),
...          np.sin(np.linspace(0, 2*np.pi, 500)),
...          c='k')
>>> plt.scatter(np.cos(angles), np.sin(angles), c='k')
>>> plt.scatter(np.cos(circmean), np.sin(circmean), c='b',
...             label='circmean')
>>> plt.scatter(np.cos(mean), np.sin(mean), c='r', label='mean')
>>> plt.legend()
>>> plt.axis('equal')
>>> plt.show()