circmean#
- scipy.stats.circmean(samples, high=6.283185307179586, low=0, axis=None, nan_policy='propagate', *, keepdims=False)[source]#
Compute the circular mean of a sample of angle observations.
Given \(n\) angle observations \(x_1, \cdots, x_n\) measured in radians, their circular mean is defined by ([1], Eq. 2.2.4)
\[\mathrm{Arg} \left( \frac{1}{n} \sum_{k=1}^n e^{i x_k} \right)\]where \(i\) is the imaginary unit and \(\mathop{\mathrm{Arg}} z\) gives the principal value of the argument of complex number \(z\), restricted to the range \([0,2\pi]\) by default. \(z\) in the above expression is known as the mean resultant vector.
- Parameters:
- samplesarray_like
Input array of angle observations. The value of a full angle is equal to
(high - low).- highfloat, optional
Upper boundary of the principal value of an angle. Default is
2*pi.- lowfloat, optional
Lower boundary of the principal value of an angle. Default is
0.- axisint or None, default: None
If an int, the axis of the input along which to compute the statistic. The statistic of each axis-slice (e.g. row) of the input will appear in a corresponding element of the output. If
None, the input will be raveled before computing the statistic.- nan_policy{‘propagate’, ‘omit’, ‘raise’}
Defines how to handle input NaNs.
propagate: if a NaN is present in the axis slice (e.g. row) along which the statistic is computed, the corresponding entry of the output will be NaN.omit: NaNs will be omitted when performing the calculation. If insufficient data remains in the axis slice along which the statistic is computed, the corresponding entry of the output will be NaN.raise: if a NaN is present, aValueErrorwill be raised.
- keepdimsbool, default: False
If this is set to True, the axes which are reduced are left in the result as dimensions with size one. With this option, the result will broadcast correctly against the input array.
- Returns:
- circmeanfloat
Circular mean, restricted to the range
[low, high].If the mean resultant vector is zero, an input-dependent, implementation-defined number between
[low, high]is returned. If the input array is empty,np.nanis returned.
Notes
Beginning in SciPy 1.9,
np.matrixinputs (not recommended for new code) are converted tonp.ndarraybefore the calculation is performed. In this case, the output will be a scalar ornp.ndarrayof appropriate shape rather than a 2Dnp.matrix. Similarly, while masked elements of masked arrays are ignored, the output will be a scalar ornp.ndarrayrather than a masked array withmask=False.References
[1]Mardia, K. V. and Jupp, P. E. Directional Statistics. John Wiley & Sons, 1999.
Examples
For readability, all angles are printed out in degrees.
>>> import numpy as np
>>> from scipy.stats import circmean
>>> import matplotlib.pyplot as plt
>>> angles = np.deg2rad(np.array([20, 30, 330]))
>>> circmean = circmean(angles)
>>> np.rad2deg(circmean)
7.294976657784009
>>> mean = angles.mean()
>>> np.rad2deg(mean)
126.66666666666666
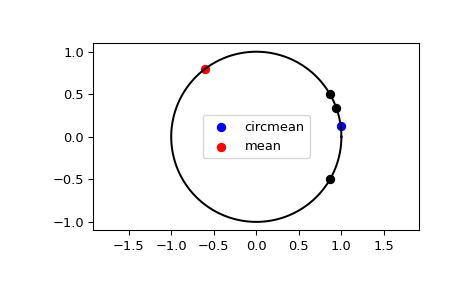
Plot and compare the circular mean against the arithmetic mean.
>>> plt.plot(np.cos(np.linspace(0, 2*np.pi, 500)),
...          np.sin(np.linspace(0, 2*np.pi, 500)),
...          c='k')
>>> plt.scatter(np.cos(angles), np.sin(angles), c='k')
>>> plt.scatter(np.cos(circmean), np.sin(circmean), c='b',
...             label='circmean')
>>> plt.scatter(np.cos(mean), np.sin(mean), c='r', label='mean')
>>> plt.legend()
>>> plt.axis('equal')
>>> plt.show()