scipy.stats.circstd#
- scipy.stats.circstd(samples, high=6.283185307179586, low=0, axis=None, nan_policy='propagate', *, normalize=False)[source]#
Compute the circular standard deviation for samples assumed to be in the range [low to high].
- Parameters:
- samplesarray_like
Input array.
- highfloat or int, optional
High boundary for the sample range. Default is
2*pi.- lowfloat or int, optional
Low boundary for the sample range. Default is 0.
- axisint, optional
Axis along which standard deviations are computed. The default is to compute the standard deviation of the flattened array.
- nan_policy{‘propagate’, ‘raise’, ‘omit’}, optional
Defines how to handle when input contains nan. ‘propagate’ returns nan, ‘raise’ throws an error, ‘omit’ performs the calculations ignoring nan values. Default is ‘propagate’.
- normalizeboolean, optional
If True, the returned value is equal to
sqrt(-2*log(R))and does not depend on the variable units. If False (default), the returned value is scaled by((high-low)/(2*pi)).
- Returns:
- circstdfloat
Circular standard deviation.
Notes
This uses a definition of circular standard deviation from [1]. Essentially, the calculation is as follows.
import numpy as np
C = np.cos(samples).mean()
S = np.sin(samples).mean()
R = np.sqrt(C**2 + S**2)
l = 2*np.pi / (high-low)
circstd = np.sqrt(-2*np.log(R)) / l
In the limit of small angles, it returns a number close to the ‘linear’ standard deviation.
References
[1]Mardia, K. V. (1972). 2. In Statistics of Directional Data (pp. 18-24). Academic Press. DOI:10.1016/C2013-0-07425-7.
Examples
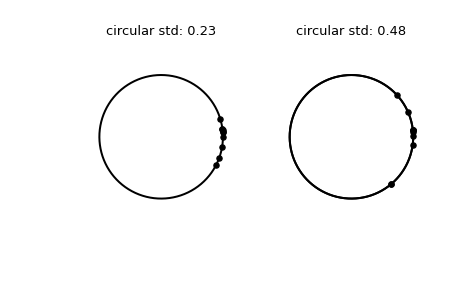
>>> import numpy as np
>>> from scipy.stats import circstd
>>> import matplotlib.pyplot as plt
>>> samples_1 = np.array([0.072, -0.158, 0.077, 0.108, 0.286,
...                       0.133, -0.473, -0.001, -0.348, 0.131])
>>> samples_2 = np.array([0.111, -0.879, 0.078, 0.733, 0.421,
...                       0.104, -0.136, -0.867,  0.012,  0.105])
>>> circstd_1 = circstd(samples_1)
>>> circstd_2 = circstd(samples_2)
Plot the samples.
>>> fig, (left, right) = plt.subplots(ncols=2)
>>> for image in (left, right):
...     image.plot(np.cos(np.linspace(0, 2*np.pi, 500)),
...                np.sin(np.linspace(0, 2*np.pi, 500)),
...                c='k')
...     image.axis('equal')
...     image.axis('off')
>>> left.scatter(np.cos(samples_1), np.sin(samples_1), c='k', s=15)
>>> left.set_title(f"circular std: {np.round(circstd_1, 2)!r}")
>>> right.plot(np.cos(np.linspace(0, 2*np.pi, 500)),
...            np.sin(np.linspace(0, 2*np.pi, 500)),
...            c='k')
>>> right.scatter(np.cos(samples_2), np.sin(samples_2), c='k', s=15)
>>> right.set_title(f"circular std: {np.round(circstd_2, 2)!r}")
>>> plt.show()