scipy.stats.circvar#
- scipy.stats.circvar(samples, high=6.283185307179586, low=0, axis=None, nan_policy='propagate')[source]#
Compute the circular variance for samples assumed to be in a range.
- Parameters:
- samplesarray_like
Input array.
- highfloat or int, optional
High boundary for the sample range. Default is
2*pi.- lowfloat or int, optional
Low boundary for the sample range. Default is 0.
- axisint, optional
Axis along which variances are computed. The default is to compute the variance of the flattened array.
- nan_policy{‘propagate’, ‘raise’, ‘omit’}, optional
Defines how to handle when input contains nan. ‘propagate’ returns nan, ‘raise’ throws an error, ‘omit’ performs the calculations ignoring nan values. Default is ‘propagate’.
- Returns:
- circvarfloat
Circular variance.
Notes
This uses the following definition of circular variance:
1-R, whereRis the mean resultant vector. The returned value is in the range [0, 1], 0 standing for no variance, and 1 for a large variance. In the limit of small angles, this value is similar to half the ‘linear’ variance.References
[1]Fisher, N.I. Statistical analysis of circular data. Cambridge University Press, 1993.
Examples
>>> import numpy as np
>>> from scipy.stats import circvar
>>> import matplotlib.pyplot as plt
>>> samples_1 = np.array([0.072, -0.158, 0.077, 0.108, 0.286,
...                       0.133, -0.473, -0.001, -0.348, 0.131])
>>> samples_2 = np.array([0.111, -0.879, 0.078, 0.733, 0.421,
...                       0.104, -0.136, -0.867,  0.012,  0.105])
>>> circvar_1 = circvar(samples_1)
>>> circvar_2 = circvar(samples_2)
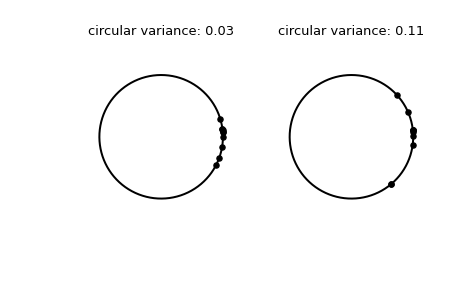
Plot the samples.
>>> fig, (left, right) = plt.subplots(ncols=2)
>>> for image in (left, right):
...     image.plot(np.cos(np.linspace(0, 2*np.pi, 500)),
...                np.sin(np.linspace(0, 2*np.pi, 500)),
...                c='k')
...     image.axis('equal')
...     image.axis('off')
>>> left.scatter(np.cos(samples_1), np.sin(samples_1), c='k', s=15)
>>> left.set_title(f"circular variance: {np.round(circvar_1, 2)!r}")
>>> right.scatter(np.cos(samples_2), np.sin(samples_2), c='k', s=15)
>>> right.set_title(f"circular variance: {np.round(circvar_2, 2)!r}")
>>> plt.show()