chebyt#
- scipy.special.chebyt(n, monic=False)[source]#
Chebyshev polynomial of the first kind.
Defined to be the solution of
\[(1 - x^2)\frac{d^2}{dx^2}T_n(x) - x\frac{d}{dx}T_n(x) + n^2T_n(x) = 0;\]\(T_n\) is a polynomial of degree \(n\).
- Parameters:
- nint
Degree of the polynomial.
- monicbool, optional
If True, scale the leading coefficient to be 1. Default is False.
- Returns:
- Torthopoly1d
Chebyshev polynomial of the first kind.
See also
chebyuChebyshev polynomial of the second kind.
Notes
The polynomials \(T_n\) are orthogonal over \([-1, 1]\) with weight function \((1 - x^2)^{-1/2}\).
References
[AS]Milton Abramowitz and Irene A. Stegun, eds. Handbook of Mathematical Functions with Formulas, Graphs, and Mathematical Tables. New York: Dover, 1972.
Examples
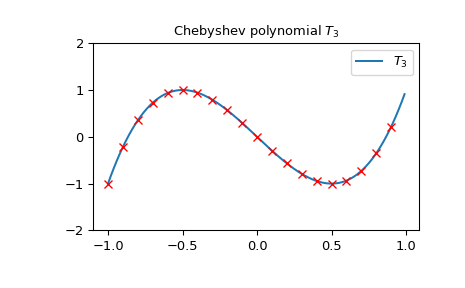
Chebyshev polynomials of the first kind of order \(n\) can be obtained as the determinant of specific \(n \times n\) matrices. As an example we can check how the points obtained from the determinant of the following \(3 \times 3\) matrix lay exactly on \(T_3\):
>>> import numpy as np
>>> import matplotlib.pyplot as plt
>>> from scipy.linalg import det
>>> from scipy.special import chebyt
>>> x = np.arange(-1.0, 1.0, 0.01)
>>> fig, ax = plt.subplots()
>>> ax.set_ylim(-2.0, 2.0)
>>> ax.set_title(r'Chebyshev polynomial $T_3$')
>>> ax.plot(x, chebyt(3)(x), label=rf'$T_3$')
>>> for p in np.arange(-1.0, 1.0, 0.1):
...     ax.plot(p,
...             det(np.array([[p, 1, 0], [1, 2*p, 1], [0, 1, 2*p]])),
...             'rx')
>>> plt.legend(loc='best')
>>> plt.show()
They are also related to the Jacobi Polynomials \(P_n^{(-0.5, -0.5)}\) through the relation:
\[P_n^{(-0.5, -0.5)}(x) = \frac{1}{4^n} \binom{2n}{n} T_n(x)\]Let’s verify it for \(n = 3\):
>>> from scipy.special import binom
>>> from scipy.special import jacobi
>>> x = np.arange(-1.0, 1.0, 0.01)
>>> np.allclose(jacobi(3, -0.5, -0.5)(x),
...             1/64 * binom(6, 3) * chebyt(3)(x))
True
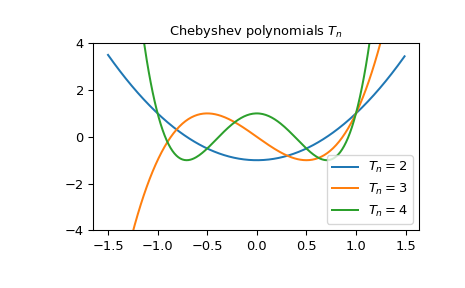
We can plot the Chebyshev polynomials \(T_n\) for some values of \(n\):
>>> x = np.arange(-1.5, 1.5, 0.01)
>>> fig, ax = plt.subplots()
>>> ax.set_ylim(-4.0, 4.0)
>>> ax.set_title(r'Chebyshev polynomials $T_n$')
>>> for n in np.arange(2,5):
...     ax.plot(x, chebyt(n)(x), label=rf'$T_n={n}$')
>>> plt.legend(loc='best')
>>> plt.show()