remez#
- scipy.signal.remez(numtaps, bands, desired, *, weight=None, type='bandpass', maxiter=25, grid_density=16, fs=None)[source]#
Calculate the minimax optimal filter using the Remez exchange algorithm.
Calculate the filter-coefficients for the finite impulse response (FIR) filter whose transfer function minimizes the maximum error between the desired gain and the realized gain in the specified frequency bands using the Remez exchange algorithm.
- Parameters:
- numtapsint
The desired number of taps in the filter. The number of taps is the number of terms in the filter, or the filter order plus one.
- bandsarray_like
A monotonic sequence containing the band edges. All elements must be non-negative and less than half the sampling frequency as given by fs.
- desiredarray_like
A sequence half the size of bands containing the desired gain in each of the specified bands.
- weightarray_like, optional
A relative weighting to give to each band region. The length of weight has to be half the length of bands.
- type{‘bandpass’, ‘differentiator’, ‘hilbert’}, optional
The type of filter:
‘bandpass’ : flat response in bands. This is the default.
‘differentiator’ : frequency proportional response in bands.
‘hilbert’ : filter with odd symmetry, that is, type III (for even order) or type IV (for odd order) linear phase filters.
- maxiterint, optional
Maximum number of iterations of the algorithm. Default is 25.
- grid_densityint, optional
Grid density. The dense grid used in
remezis of size(numtaps + 1) * grid_density. Default is 16.- fsfloat, optional
The sampling frequency of the signal. Default is 1.
- Returns:
- outndarray
A rank-1 array containing the coefficients of the optimal (in a minimax sense) filter.
See also
Notes
Array API Standard Support
remezhas experimental support for Python Array API Standard compatible backends in addition to NumPy. Please consider testing these features by setting an environment variableSCIPY_ARRAY_API=1and providing CuPy, PyTorch, JAX, or Dask arrays as array arguments. The following combinations of backend and device (or other capability) are supported.Library
CPU
GPU
NumPy
✅
n/a
CuPy
n/a
⛔
PyTorch
✅
⛔
JAX
⚠️ no JIT
⛔
Dask
⚠️ computes graph
n/a
See Support for the array API standard for more information.
References
[1]J. H. McClellan and T. W. Parks, “A unified approach to the design of optimum FIR linear phase digital filters”, IEEE Trans. Circuit Theory, vol. CT-20, pp. 697-701, 1973.
[2]J. H. McClellan, T. W. Parks and L. R. Rabiner, “A Computer Program for Designing Optimum FIR Linear Phase Digital Filters”, IEEE Trans. Audio Electroacoust., vol. AU-21, pp. 506-525, 1973.
Examples
In these examples,
remezis used to design low-pass, high-pass, band-pass and band-stop filters. The parameters that define each filter are the filter order, the band boundaries, the transition widths of the boundaries, the desired gains in each band, and the sampling frequency.We’ll use a sample frequency of 22050 Hz in all the examples. In each example, the desired gain in each band is either 0 (for a stop band) or 1 (for a pass band).
freqzis used to compute the frequency response of each filter, and the utility functionplot_responsedefined below is used to plot the response.>>> import numpy as np >>> from scipy import signal >>> import matplotlib.pyplot as plt
>>> fs = 22050 # Sample rate, Hz
>>> def plot_response(w, h, title):
...     "Utility function to plot response functions"
...     fig = plt.figure()
...     ax = fig.add_subplot(111)
...     ax.plot(w, 20*np.log10(np.abs(h)))
...     ax.set_ylim(-40, 5)
...     ax.grid(True)
...     ax.set_xlabel('Frequency (Hz)')
...     ax.set_ylabel('Gain (dB)')
...     ax.set_title(title)
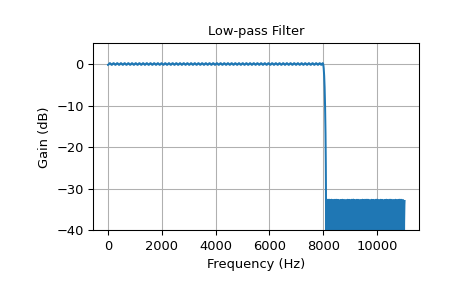
The first example is a low-pass filter, with cutoff frequency 8 kHz. The filter length is 325, and the transition width from pass to stop is 100 Hz.
>>> cutoff = 8000.0    # Desired cutoff frequency, Hz
>>> trans_width = 100  # Width of transition from pass to stop, Hz
>>> numtaps = 325      # Size of the FIR filter.
>>> taps = signal.remez(numtaps, [0, cutoff, cutoff + trans_width, 0.5*fs],
...                     [1, 0], fs=fs)
>>> w, h = signal.freqz(taps, [1], worN=2000, fs=fs)
>>> plot_response(w, h, "Low-pass Filter")
>>> plt.show()
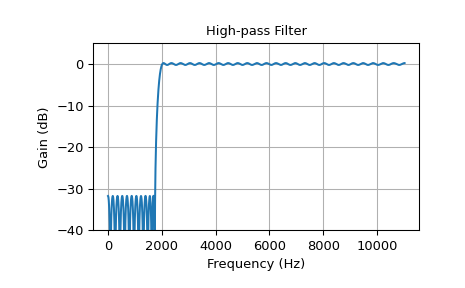
This example shows a high-pass filter:
>>> cutoff = 2000.0    # Desired cutoff frequency, Hz
>>> trans_width = 250  # Width of transition from pass to stop, Hz
>>> numtaps = 125      # Size of the FIR filter.
>>> taps = signal.remez(numtaps, [0, cutoff - trans_width, cutoff, 0.5*fs],
...                     [0, 1], fs=fs)
>>> w, h = signal.freqz(taps, [1], worN=2000, fs=fs)
>>> plot_response(w, h, "High-pass Filter")
>>> plt.show()
This example shows a band-pass filter with a pass-band from 2 kHz to 5 kHz. The transition width is 260 Hz and the length of the filter is 63, which is smaller than in the other examples:
>>> band = [2000, 5000]  # Desired pass band, Hz
>>> trans_width = 260    # Width of transition from pass to stop, Hz
>>> numtaps = 63         # Size of the FIR filter.
>>> edges = [0, band[0] - trans_width, band[0], band[1],
...          band[1] + trans_width, 0.5*fs]
>>> taps = signal.remez(numtaps, edges, [0, 1, 0], fs=fs)
>>> w, h = signal.freqz(taps, [1], worN=2000, fs=fs)
>>> plot_response(w, h, "Band-pass Filter")
>>> plt.show()
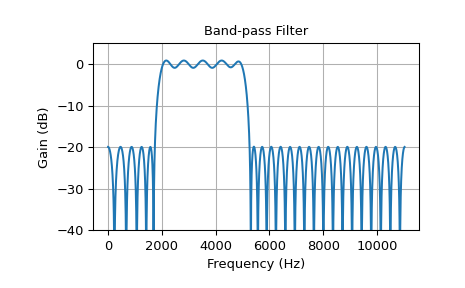
The low order leads to higher ripple and less steep transitions.
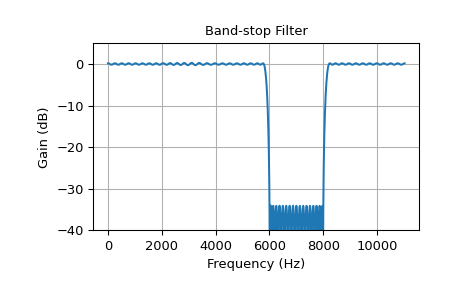
The next example shows a band-stop filter.
>>> band = [6000, 8000]  # Desired stop band, Hz
>>> trans_width = 200    # Width of transition from pass to stop, Hz
>>> numtaps = 175        # Size of the FIR filter.
>>> edges = [0, band[0] - trans_width, band[0], band[1],
...          band[1] + trans_width, 0.5*fs]
>>> taps = signal.remez(numtaps, edges, [1, 0, 1], fs=fs)
>>> w, h = signal.freqz(taps, [1], worN=2000, fs=fs)
>>> plot_response(w, h, "Band-stop Filter")
>>> plt.show()