scipy.stats.permutation_test#
- scipy.stats.permutation_test(data, statistic, *, permutation_type='independent', vectorized=False, n_resamples=9999, batch=None, alternative='two-sided', axis=0, random_state=None)[source]#
Performs a permutation test of a given statistic on provided data.
For independent sample statistics, the null hypothesis is that the data are randomly sampled from the same distribution. For paired sample statistics, two null hypothesis can be tested: that the data are paired at random or that the data are assigned to samples at random.
- Parameters
- dataiterable of array-like
Contains the samples, each of which is an array of observations. Dimensions of sample arrays must be compatible for broadcasting except along axis.
- statisticcallable
Statistic for which the p-value of the hypothesis test is to be calculated. statistic must be a callable that accepts samples as separate arguments (e.g.
statistic(*data)) and returns the resulting statistic. If vectorized is setTrue, statistic must also accept a keyword argument axis and be vectorized to compute the statistic along the provided axis of the sample arrays.- permutation_type{‘independent’, ‘samples’, ‘pairings’}, optional
The type of permutations to be performed, in accordance with the null hypothesis. The first two permutation types are for paired sample statistics, in which all samples contain the same number of observations and observations with corresponding indices along axis are considered to be paired; the third is for independent sample statistics.
'samples': observations are assigned to different samples but remain paired with the same observations from other samples. This permutation type is appropriate for paired sample hypothesis tests such as the Wilcoxon signed-rank test and the paired t-test.'pairings': observations are paired with different observations, but they remain within the same sample. This permutation type is appropriate for association/correlation tests with statistics such as Spearman’s \(\rho\), Kendall’s \(\tau\), and Pearson’s \(r\).'independent'(default) : observations are assigned to different samples. Samples may contain different numbers of observations. This permutation type is appropriate for independent sample hypothesis tests such as the Mann-Whitney \(U\) test and the independent sample t-test.Please see the Notes section below for more detailed descriptions of the permutation types.
- vectorizedbool, default:
False By default, statistic is assumed to calculate the statistic only for 1D arrays contained in data. If vectorized is set
True, statistic must also accept a keyword argument axis and be vectorized to compute the statistic along the provided axis of the ND arrays in data. Use of a vectorized statistic can reduce computation time.- n_resamplesint or np.inf, default: 9999
Number of random permutations (resamples) used to approximate the null distribution. If greater than or equal to the number of distinct permutations, the exact null distribution will be computed. Note that the number of distinct permutations grows very rapidly with the sizes of samples, so exact tests are feasible only for very small data sets.
- batchint, optional
The number of permutations to process in each call to statistic. Memory usage is O(batch`*``n`), where
nis the total size of all samples, regardless of the value of vectorized. Default isNone, in which casebatchis the number of permutations.- alternative{‘two-sided’, ‘less’, ‘greater’}, optional
The alternative hypothesis for which the p-value is calculated. For each alternative, the p-value is defined for exact tests as follows.
'greater': the percentage of the null distribution that is greater than or equal to the observed value of the test statistic.'less': the percentage of the null distribution that is less than or equal to the observed value of the test statistic.'two-sided'(default) : twice the smaller of the p-values above.
Note that p-values for randomized tests are calculated according to the conservative (over-estimated) approximation suggested in [2] and [3] rather than the unbiased estimator suggested in [4]. That is, when calculating the proportion of the randomized null distribution that is as extreme as the observed value of the test statistic, the values in the numerator and denominator are both increased by one. An interpretation of this adjustment is that the observed value of the test statistic is always included as an element of the randomized null distribution. The convention used for two-sided p-values is not universal; the observed test statistic and null distribution are returned in case a different definition is preferred.
- axisint, default: 0
The axis of the (broadcasted) samples over which to calculate the statistic. If samples have a different number of dimensions, singleton dimensions are prepended to samples with fewer dimensions before axis is considered.
- random_state{None, int,
numpy.random.Generator, numpy.random.RandomState}, optionalPseudorandom number generator state used to generate permutations.
If random_state is
None(default), thenumpy.random.RandomStatesingleton is used. If random_state is an int, a newRandomStateinstance is used, seeded with random_state. If random_state is already aGeneratororRandomStateinstance then that instance is used.
- Returns
- statisticfloat or ndarray
The observed test statistic of the data.
- pvaluefloat or ndarray
The p-value for the given alternative.
- null_distributionndarray
The values of the test statistic generated under the null hypothesis.
Notes
The three types of permutation tests supported by this function are described below.
Unpaired statistics (
permutation_type='independent'):The null hypothesis associated with this permutation type is that all observations are sampled from the same underlying distribution and that they have been assigned to one of the samples at random.
Suppose
datacontains two samples; e.g.a, b = data. When1 < n_resamples < binom(n, k), wherekis the number of observations ina,nis the total number of observations inaandb, andbinom(n, k)is the binomial coefficient (nchoosek),
the data are pooled (concatenated), randomly assigned to either the first or second sample, and the statistic is calculated. This process is performed repeatedly, permutation times, generating a distribution of the statistic under the null hypothesis. The statistic of the original data is compared to this distribution to determine the p-value.
When
n_resamples >= binom(n, k), an exact test is performed: the data are partitioned between the samples in each distinct way exactly once, and the exact null distribution is formed. Note that for a given partitioning of the data between the samples, only one ordering/permutation of the data within each sample is considered. For statistics that do not depend on the order of the data within samples, this dramatically reduces computational cost without affecting the shape of the null distribution (because the frequency/count of each value is affected by the same factor).For
a = [a1, a2, a3, a4]andb = [b1, b2, b3], an example of this permutation type isx = [b3, a1, a2, b2]andy = [a4, b1, a3]. Because only one ordering/permutation of the data within each sample is considered in an exact test, a resampling likex = [b3, a1, b2, a2]andy = [a4, a3, b1]would not be considered distinct from the example above.permutation_type='independent'does not support one-sample statistics, but it can be applied to statistics with more than two samples. In this case, ifnis an array of the number of observations within each sample, the number of distinct partitions is:np.product([binom(sum(n[i:]), sum(n[i+1:])) for i in range(len(n)-1)])
Paired statistics, permute pairings (
permutation_type='pairings'):The null hypothesis associated with this permutation type is that observations within each sample are drawn from the same underlying distribution and that pairings with elements of other samples are assigned at random.
Suppose
datacontains only one sample; e.g.a, = data, and we wish to consider all possible pairings of elements ofawith elements of a second sample,b. Letnbe the number of observations ina, which must also equal the number of observations inb.When
1 < n_resamples < factorial(n), the elements ofaare randomly permuted. The user-supplied statistic accepts one data argument, saya_perm, and calculates the statistic consideringa_permandb. This process is performed repeatedly, permutation times, generating a distribution of the statistic under the null hypothesis. The statistic of the original data is compared to this distribution to determine the p-value.When
n_resamples >= factorial(n), an exact test is performed:ais permuted in each distinct way exactly once. Therefore, the statistic is computed for each unique pairing of samples betweenaandbexactly once.For
a = [a1, a2, a3]andb = [b1, b2, b3], an example of this permutation type isa_perm = [a3, a1, a2]whilebis left in its original order.permutation_type='pairings'supportsdatacontaining any number of samples, each of which must contain the same number of observations. All samples provided indataare permuted independently. Therefore, ifmis the number of samples andnis the number of observations within each sample, then the number of permutations in an exact test is:factorial(n)**m
Note that if a two-sample statistic, for example, does not inherently depend on the order in which observations are provided - only on the pairings of observations - then only one of the two samples should be provided in
data. This dramatically reduces computational cost without affecting the shape of the null distribution (because the frequency/count of each value is affected by the same factor).Paired statistics, permute samples (
permutation_type='samples'):The null hypothesis associated with this permutation type is that observations within each pair are drawn from the same underlying distribution and that the sample to which they are assigned is random.
Suppose
datacontains two samples; e.g.a, b = data. Letnbe the number of observations ina, which must also equal the number of observations inb.When
1 < n_resamples < 2**n, the elements ofaarebare randomly swapped between samples (maintaining their pairings) and the statistic is calculated. This process is performed repeatedly, permutation times, generating a distribution of the statistic under the null hypothesis. The statistic of the original data is compared to this distribution to determine the p-value.When
n_resamples >= 2**n, an exact test is performed: the observations are assigned to the two samples in each distinct way (while maintaining pairings) exactly once.For
a = [a1, a2, a3]andb = [b1, b2, b3], an example of this permutation type isx = [b1, a2, b3]andy = [a1, b2, a3].permutation_type='samples'supportsdatacontaining any number of samples, each of which must contain the same number of observations. Ifdatacontains more than one sample, paired observations withindataare exchanged between samples independently. Therefore, ifmis the number of samples andnis the number of observations within each sample, then the number of permutations in an exact test is:factorial(m)**n
Several paired-sample statistical tests, such as the Wilcoxon signed rank test and paired-sample t-test, can be performed considering only the difference between two paired elements. Accordingly, if
datacontains only one sample, then the null distribution is formed by independently changing the sign of each observation.References
- 1
Fisher. The Design of Experiments, 6th Ed (1951).
- 2
B. Phipson and G. K. Smyth. “Permutation P-values Should Never Be Zero: Calculating Exact P-values When Permutations Are Randomly Drawn.” Statistical Applications in Genetics and Molecular Biology 9.1 (2010).
- 3
M. D. Ernst. “Permutation Methods: A Basis for Exact Inference”. Statistical Science (2004).
- 4
B. Efron and R. J. Tibshirani. An Introduction to the Bootstrap (1993).
Examples
Suppose we wish to test whether two samples are drawn from the same distribution. Assume that the underlying distributions are unknown to us, and that before observing the data, we hypothesized that the mean of the first sample would be less than that of the second sample. We decide that we will use the difference between the sample means as a test statistic, and we will consider a p-value of 0.05 to be statistically significant.
For efficiency, we write the function defining the test statistic in a vectorized fashion: the samples
xandycan be ND arrays, and the statistic will be calculated for each axis-slice along axis.>>> def statistic(x, y, axis): ... return np.mean(x, axis=axis) - np.mean(y, axis=axis)
After collecting our data, we calculate the observed value of the test statistic.
>>> from scipy.stats import norm
>>> rng = np.random.default_rng()
>>> x = norm.rvs(size=5, random_state=rng)
>>> y = norm.rvs(size=6, loc = 3, random_state=rng)
>>> statistic(x, y, 0)
-3.5411688580987266
Indeed, the test statistic is negative, suggesting that the true mean of the distribution underlying
xis less than that of the distribution underlyingy. To determine the probability of this occuring by chance if the two samples were drawn from the same distribution, we perform a permutation test.>>> from scipy.stats import permutation_test >>> # because our statistic is vectorized, we pass `vectorized=True` >>> # `n_resamples=np.inf` indicates that an exact test is to be performed >>> res = permutation_test((x, y), statistic, vectorized=True, ... n_resamples=np.inf, alternative='less') >>> print(res.statistic) -3.5411688580987266 >>> print(res.pvalue) 0.004329004329004329
The probability of obtaining a test statistic less than or equal to the observed value under the null hypothesis is 0.4329%. This is less than our chosen threshold of 5%, so we consider this to to be significant evidence against the null hypothesis in favor of the alternative.
Because the size of the samples above was small,
permutation_testcould perform an exact test. For larger samples, we resort to a randomized permutation test.>>> x = norm.rvs(size=100, random_state=rng) >>> y = norm.rvs(size=120, loc=0.3, random_state=rng) >>> res = permutation_test((x, y), statistic, n_resamples=100000, ... vectorized=True, alternative='less', ... random_state=rng) >>> print(res.statistic) -0.5230459671240913 >>> print(res.pvalue) 0.00016999830001699983
The approximate probability of obtaining a test statistic less than or equal to the observed value under the null hypothesis is 0.0225%. This is again less than our chosen threshold of 5%, so again we have significant evidence to reject the null hypothesis in favor of the alternative.
For large samples and number of permutations, the result is comparable to that of the corresponding asymptotic test, the independent sample t-test.
>>> from scipy.stats import ttest_ind
>>> res_asymptotic = ttest_ind(x, y, alternative='less')
>>> print(res_asymptotic.pvalue)
0.00012688101537979522
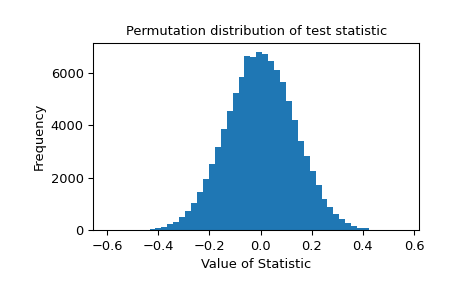
The permutation distribution of the test statistic is provided for further investigation.
>>> import matplotlib.pyplot as plt
>>> plt.hist(res.null_distribution, bins=50)
>>> plt.title("Permutation distribution of test statistic")
>>> plt.xlabel("Value of Statistic")
>>> plt.ylabel("Frequency")