scipy.signal.iircomb
-
scipy.signal.iircomb(w0, Q, ftype='notch', fs=2.0)[source]¶ Design IIR notching or peaking digital comb filter.
A notching comb filter is a band-stop filter with a narrow bandwidth (high quality factor). It rejects a narrow frequency band and leaves the rest of the spectrum little changed.
A peaking comb filter is a band-pass filter with a narrow bandwidth (high quality factor). It rejects components outside a narrow frequency band.
- Parameters
- w0float
Frequency to attenuate (notching) or boost (peaking). If fs is specified, this is in the same units as fs. By default, it is a normalized scalar that must satisfy
0 < w0 < 1, withw0 = 1corresponding to half of the sampling frequency.- Qfloat
Quality factor. Dimensionless parameter that characterizes notch filter -3 dB bandwidth
bwrelative to its center frequency,Q = w0/bw.- ftype{‘notch’, ‘peak’}
The type of comb filter generated by the function. If ‘notch’, then it returns a filter with notches at frequencies
0,w0,2 * w0, etc. If ‘peak’, then it returns a filter with peaks at frequencies0.5 * w0,1.5 * w0,2.5 * w0`, etc. Default is ‘notch’.- fsfloat, optional
The sampling frequency of the signal. Default is 2.0.
- Returns
- b, andarray, ndarray
Numerator (
b) and denominator (a) polynomials of the IIR filter.
- Raises
- ValueError
If w0 is less than or equal to 0 or greater than or equal to
fs/2, if fs is not divisible by w0, if ftype is not ‘notch’ or ‘peak’
Notes
For implementation details, see [1]. The TF implementation of the comb filter is numerically stable even at higher orders due to the use of a single repeated pole, which won’t suffer from precision loss.
References
- 1
Sophocles J. Orfanidis, “Introduction To Signal Processing”, Prentice-Hall, 1996
Examples
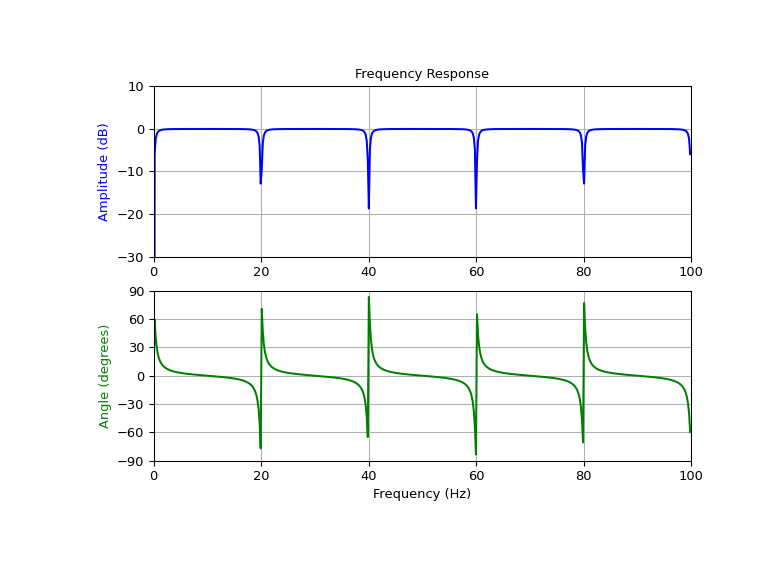
Design and plot notching comb filter at 20 Hz for a signal sampled at 200 Hz, using quality factor Q = 30
>>> from scipy import signal
>>> import matplotlib.pyplot as plt
>>> fs = 200.0  # Sample frequency (Hz)
>>> f0 = 20.0  # Frequency to be removed from signal (Hz)
>>> Q = 30.0  # Quality factor
>>> # Design notching comb filter
>>> b, a = signal.iircomb(f0, Q, ftype='notch', fs=fs)
>>> # Frequency response
>>> freq, h = signal.freqz(b, a, fs=fs)
>>> response = abs(h)
>>> # To avoid divide by zero when graphing
>>> response[response == 0] = 1e-20
>>> # Plot
>>> fig, ax = plt.subplots(2, 1, figsize=(8, 6))
>>> ax[0].plot(freq, 20*np.log10(abs(response)), color='blue')
>>> ax[0].set_title("Frequency Response")
>>> ax[0].set_ylabel("Amplitude (dB)", color='blue')
>>> ax[0].set_xlim([0, 100])
>>> ax[0].set_ylim([-30, 10])
>>> ax[0].grid()
>>> ax[1].plot(freq, np.unwrap(np.angle(h))*180/np.pi, color='green')
>>> ax[1].set_ylabel("Angle (degrees)", color='green')
>>> ax[1].set_xlabel("Frequency (Hz)")
>>> ax[1].set_xlim([0, 100])
>>> ax[1].set_yticks([-90, -60, -30, 0, 30, 60, 90])
>>> ax[1].set_ylim([-90, 90])
>>> ax[1].grid()
>>> plt.show()
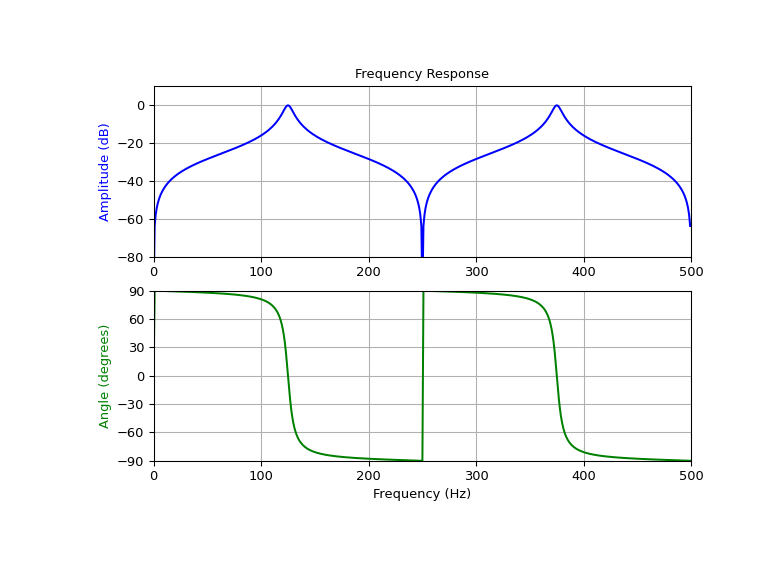
Design and plot peaking comb filter at 250 Hz for a signal sampled at 1000 Hz, using quality factor Q = 30
>>> fs = 1000.0  # Sample frequency (Hz)
>>> f0 = 250.0  # Frequency to be retained (Hz)
>>> Q = 30.0  # Quality factor
>>> # Design peaking filter
>>> b, a = signal.iircomb(f0, Q, ftype='peak', fs=fs)
>>> # Frequency response
>>> freq, h = signal.freqz(b, a, fs=fs)
>>> response = abs(h)
>>> # To avoid divide by zero when graphing
>>> response[response == 0] = 1e-20
>>> # Plot
>>> fig, ax = plt.subplots(2, 1, figsize=(8, 6))
>>> ax[0].plot(freq, 20*np.log10(np.maximum(abs(h), 1e-5)), color='blue')
>>> ax[0].set_title("Frequency Response")
>>> ax[0].set_ylabel("Amplitude (dB)", color='blue')
>>> ax[0].set_xlim([0, 500])
>>> ax[0].set_ylim([-80, 10])
>>> ax[0].grid()
>>> ax[1].plot(freq, np.unwrap(np.angle(h))*180/np.pi, color='green')
>>> ax[1].set_ylabel("Angle (degrees)", color='green')
>>> ax[1].set_xlabel("Frequency (Hz)")
>>> ax[1].set_xlim([0, 500])
>>> ax[1].set_yticks([-90, -60, -30, 0, 30, 60, 90])
>>> ax[1].set_ylim([-90, 90])
>>> ax[1].grid()
>>> plt.show()