scipy.stats.boxcox_normmax#
- scipy.stats.boxcox_normmax(x, brack=None, method='pearsonr', optimizer=None)[source]#
Compute optimal Box-Cox transform parameter for input data.
- Parameters:
- xarray_like
Input array.
- brack2-tuple, optional, default (-2.0, 2.0)
The starting interval for a downhill bracket search for the default optimize.brent solver. Note that this is in most cases not critical; the final result is allowed to be outside this bracket. If optimizer is passed, brack must be None.
- methodstr, optional
The method to determine the optimal transform parameter (
boxcoxlmbdaparameter). Options are:- ‘pearsonr’ (default)
Maximizes the Pearson correlation coefficient between
y = boxcox(x)and the expected values foryif x would be normally-distributed.- ‘mle’
Minimizes the log-likelihood
boxcox_llf. This is the method used inboxcox.- ‘all’
Use all optimization methods available, and return all results. Useful to compare different methods.
- optimizercallable, optional
optimizer is a callable that accepts one argument:
- funcallable
The objective function to be optimized. fun accepts one argument, the Box-Cox transform parameter lmbda, and returns the negative log-likelihood function at the provided value. The job of optimizer is to find the value of lmbda that minimizes fun.
and returns an object, such as an instance of
scipy.optimize.OptimizeResult, which holds the optimal value of lmbda in an attribute x.See the example below or the documentation of
scipy.optimize.minimize_scalarfor more information.
- Returns:
- maxlogfloat or ndarray
The optimal transform parameter found. An array instead of a scalar for
method='all'.
Examples
>>> import numpy as np
>>> from scipy import stats
>>> import matplotlib.pyplot as plt
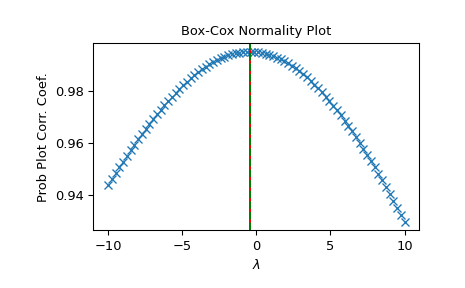
We can generate some data and determine the optimal
lmbdain various ways:>>> rng = np.random.default_rng() >>> x = stats.loggamma.rvs(5, size=30, random_state=rng) + 5 >>> y, lmax_mle = stats.boxcox(x) >>> lmax_pearsonr = stats.boxcox_normmax(x)
>>> lmax_mle
2.217563431465757
>>> lmax_pearsonr
2.238318660200961
>>> stats.boxcox_normmax(x, method='all')
array([2.23831866, 2.21756343])
>>> fig = plt.figure()
>>> ax = fig.add_subplot(111)
>>> prob = stats.boxcox_normplot(x, -10, 10, plot=ax)
>>> ax.axvline(lmax_mle, color='r')
>>> ax.axvline(lmax_pearsonr, color='g', ls='--')
>>> plt.show()
Alternatively, we can define our own optimizer function. Suppose we are only interested in values of lmbda on the interval [6, 7], we want to use
scipy.optimize.minimize_scalarwithmethod='bounded', and we want to use tighter tolerances when optimizing the log-likelihood function. To do this, we define a function that accepts positional argument fun and usesscipy.optimize.minimize_scalarto minimize fun subject to the provided bounds and tolerances:>>> from scipy import optimize >>> options = {'xatol': 1e-12} # absolute tolerance on `x` >>> def optimizer(fun): ... return optimize.minimize_scalar(fun, bounds=(6, 7), ... method="bounded", options=options) >>> stats.boxcox_normmax(x, optimizer=optimizer) 6.000...