scipy.signal.correlate2d
- scipy.signal.correlate2d(in1, in2, mode='full', boundary='fill', fillvalue=0)[source]
Cross-correlate two 2-dimensional arrays.
Cross correlate in1 and in2 with output size determined by mode, and boundary conditions determined by boundary and fillvalue.
Parameters: in1, in2 : array_like
Two-dimensional input arrays to be convolved.
mode : str {‘full’, ‘valid’, ‘same’}, optional
A string indicating the size of the output:
- full
The output is the full discrete linear cross-correlation of the inputs. (Default)
- valid
The output consists only of those elements that do not rely on the zero-padding.
- same
The output is the same size as in1, centered with respect to the ‘full’ output.
boundary : str {‘fill’, ‘wrap’, ‘symm’}, optional
A flag indicating how to handle boundaries:
- fill
pad input arrays with fillvalue. (default)
- wrap
circular boundary conditions.
- symm
symmetrical boundary conditions.
fillvalue : scalar, optional
Value to fill pad input arrays with. Default is 0.
Returns: correlate2d : ndarray
A 2-dimensional array containing a subset of the discrete linear cross-correlation of in1 with in2.
Examples
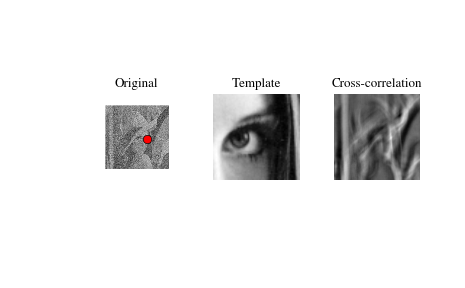
Use 2D cross-correlation to find the location of a template in a noisy image:
>>> from scipy import signal
>>> from scipy import misc
>>> lena = misc.lena() - misc.lena().mean()
>>> template = np.copy(lena[235:295, 310:370]) # right eye
>>> template -= template.mean()
>>> lena = lena + np.random.randn(*lena.shape) * 50 # add noise
>>> corr = signal.correlate2d(lena, template, boundary='symm', mode='same')
>>> y, x = np.unravel_index(np.argmax(corr), corr.shape) # find the match
>>> import matplotlib.pyplot as plt
>>> fig, (ax_orig, ax_template, ax_corr) = plt.subplots(1, 3)
>>> ax_orig.imshow(lena, cmap='gray')
>>> ax_orig.set_title('Original')
>>> ax_orig.set_axis_off()
>>> ax_template.imshow(template, cmap='gray')
>>> ax_template.set_title('Template')
>>> ax_template.set_axis_off()
>>> ax_corr.imshow(corr, cmap='gray')
>>> ax_corr.set_title('Cross-correlation')
>>> ax_corr.set_axis_off()
>>> ax_orig.plot(x, y, 'ro')
>>> fig.show()