numpy.interp
- numpy.interp(x, xp, fp, left=None, right=None)
One-dimensional linear interpolation.
Returns the one-dimensional piecewise linear interpolant to a function with given values at discrete data-points.
Parameters: x : array_like
The x-coordinates of the interpolated values.
xp : 1-D sequence of floats
The x-coordinates of the data points, must be increasing.
fp : 1-D sequence of floats
The y-coordinates of the data points, same length as xp.
left : float, optional
Value to return for x , default is fp[0].
right : float, optional
Value to return for x > xp[-1], defaults is fp[-1].
Returns: y : {float, ndarray}
The interpolated values, same shape as x.
Raises: ValueError :
If xp and fp have different length
Notes
Does not check that the x-coordinate sequence xp is increasing. If xp is not increasing, the results are nonsense. A simple check for increasingness is:
np.all(np.diff(xp) > 0)
Examples
>>> xp = [1, 2, 3]
>>> fp = [3, 2, 0]
>>> np.interp(2.5, xp, fp)
1.0
>>> np.interp([0, 1, 1.5, 2.72, 3.14], xp, fp)
array([ 3. ,  3. ,  2.5,  0.56,  0. ])
>>> UNDEF = -99.0
>>> np.interp(3.14, xp, fp, right=UNDEF)
-99.0
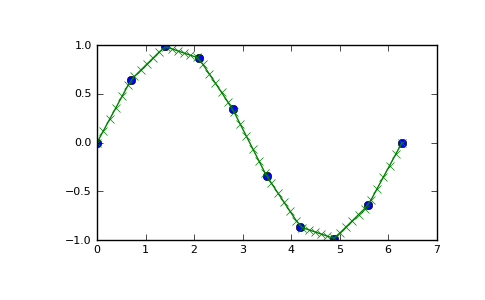
Plot an interpolant to the sine function:
>>> x = np.linspace(0, 2*np.pi, 10)
>>> y = np.sin(x)
>>> xvals = np.linspace(0, 2*np.pi, 50)
>>> yinterp = np.interp(xvals, x, y)
>>> import matplotlib.pyplot as plt
>>> plt.plot(x, y, 'o')
>>> plt.plot(xvals, yinterp, '-x')
>>> plt.show()
