scipy.signal.iirpeak
-
scipy.signal.iirpeak(w0, Q, fs=2.0)[source]¶ Design second-order IIR peak (resonant) digital filter.
A peak filter is a band-pass filter with a narrow bandwidth (high quality factor). It rejects components outside a narrow frequency band.
- Parameters
- w0float
Frequency to be retained in a signal. If fs is specified, this is in the same units as fs. By default, it is a normalized scalar that must satisfy
0 < w0 < 1, withw0 = 1corresponding to half of the sampling frequency.- Qfloat
Quality factor. Dimensionless parameter that characterizes peak filter -3 dB bandwidth
bwrelative to its center frequency,Q = w0/bw.- fsfloat, optional
The sampling frequency of the digital system.
New in version 1.2.0.
- Returns
- b, andarray, ndarray
Numerator (
b) and denominator (a) polynomials of the IIR filter.
See also
Notes
New in version 0.19.0.
References
- 1
Sophocles J. Orfanidis, “Introduction To Signal Processing”, Prentice-Hall, 1996
Examples
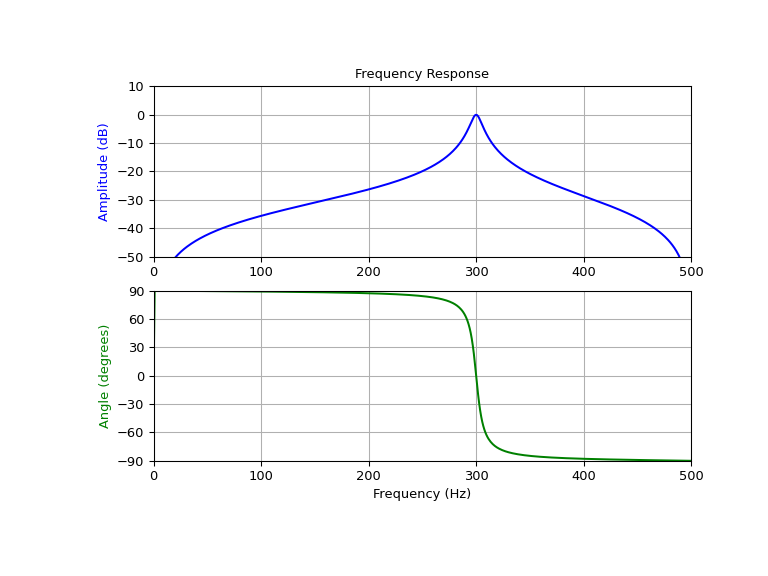
Design and plot filter to remove the frequencies other than the 300 Hz component from a signal sampled at 1000 Hz, using a quality factor Q = 30
>>> from scipy import signal
>>> import matplotlib.pyplot as plt
>>> fs = 1000.0  # Sample frequency (Hz)
>>> f0 = 300.0  # Frequency to be retained (Hz)
>>> Q = 30.0  # Quality factor
>>> # Design peak filter
>>> b, a = signal.iirpeak(f0, Q, fs)
>>> # Frequency response
>>> freq, h = signal.freqz(b, a, fs=fs)
>>> # Plot
>>> fig, ax = plt.subplots(2, 1, figsize=(8, 6))
>>> ax[0].plot(freq, 20*np.log10(np.maximum(abs(h), 1e-5)), color='blue')
>>> ax[0].set_title("Frequency Response")
>>> ax[0].set_ylabel("Amplitude (dB)", color='blue')
>>> ax[0].set_xlim([0, 500])
>>> ax[0].set_ylim([-50, 10])
>>> ax[0].grid()
>>> ax[1].plot(freq, np.unwrap(np.angle(h))*180/np.pi, color='green')
>>> ax[1].set_ylabel("Angle (degrees)", color='green')
>>> ax[1].set_xlabel("Frequency (Hz)")
>>> ax[1].set_xlim([0, 500])
>>> ax[1].set_yticks([-90, -60, -30, 0, 30, 60, 90])
>>> ax[1].set_ylim([-90, 90])
>>> ax[1].grid()
>>> plt.show()