scipy.interpolate.LinearNDInterpolator
-
class
scipy.interpolate.LinearNDInterpolator(points, values, fill_value=np.nan, rescale=False)¶ Piecewise linear interpolant in N dimensions.
New in version 0.9.
- Parameters
- pointsndarray of floats, shape (npoints, ndims); or Delaunay
Data point coordinates, or a precomputed Delaunay triangulation.
- valuesndarray of float or complex, shape (npoints, …)
Data values.
- fill_valuefloat, optional
Value used to fill in for requested points outside of the convex hull of the input points. If not provided, then the default is
nan.- rescalebool, optional
Rescale points to unit cube before performing interpolation. This is useful if some of the input dimensions have incommensurable units and differ by many orders of magnitude.
See also
griddataInterpolate unstructured D-D data.
NearestNDInterpolatorNearest-neighbor interpolation in N dimensions.
CloughTocher2DInterpolatorPiecewise cubic, C1 smooth, curvature-minimizing interpolant in 2D.
Notes
The interpolant is constructed by triangulating the input data with Qhull [1], and on each triangle performing linear barycentric interpolation.
References
Examples
We can interpolate values on a 2D plane:
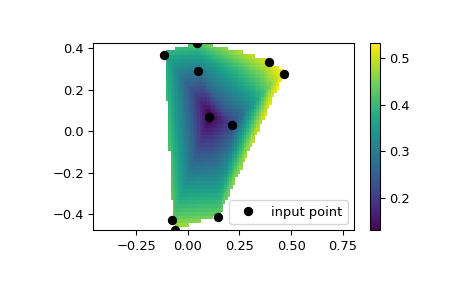
>>> from scipy.interpolate import LinearNDInterpolator
>>> import matplotlib.pyplot as plt
>>> np.random.seed(0)
>>> x = np.random.random(10) - 0.5
>>> y = np.random.random(10) - 0.5
>>> z = np.hypot(x, y)
>>> X = np.linspace(min(x), max(x))
>>> Y = np.linspace(min(y), max(y))
>>> X, Y = np.meshgrid(X, Y)  # 2D grid for interpolation
>>> interp = LinearNDInterpolator(list(zip(x, y)), z)
>>> Z = interp(X, Y)
>>> plt.pcolormesh(X, Y, Z, shading='auto')
>>> plt.plot(x, y, "ok", label="input point")
>>> plt.legend()
>>> plt.colorbar()
>>> plt.axis("equal")
>>> plt.show()
Methods
__call__(xi)Evaluate interpolator at given points.