scipy.signal.windows.tukey
-
scipy.signal.windows.tukey(M, alpha=0.5, sym=True)[source]¶ Return a Tukey window, also known as a tapered cosine window.
- Parameters
- Mint
Number of points in the output window. If zero or less, an empty array is returned.
- alphafloat, optional
Shape parameter of the Tukey window, representing the fraction of the window inside the cosine tapered region. If zero, the Tukey window is equivalent to a rectangular window. If one, the Tukey window is equivalent to a Hann window.
- symbool, optional
When True (default), generates a symmetric window, for use in filter design. When False, generates a periodic window, for use in spectral analysis.
- Returns
- wndarray
The window, with the maximum value normalized to 1 (though the value 1 does not appear if M is even and sym is True).
References
- 1
Harris, Fredric J. (Jan 1978). “On the use of Windows for Harmonic Analysis with the Discrete Fourier Transform”. Proceedings of the IEEE 66 (1): 51-83. DOI:10.1109/PROC.1978.10837
- 2
Wikipedia, “Window function”, https://en.wikipedia.org/wiki/Window_function#Tukey_window
Examples
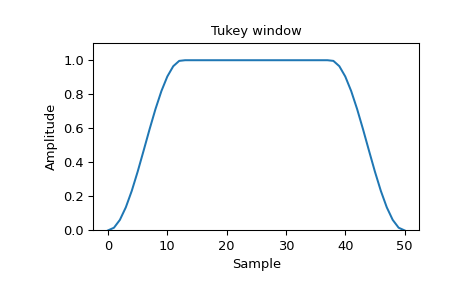
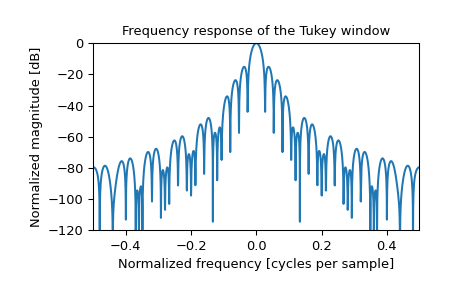
Plot the window and its frequency response:
>>> from scipy import signal
>>> from scipy.fft import fft, fftshift
>>> import matplotlib.pyplot as plt
>>> window = signal.tukey(51)
>>> plt.plot(window)
>>> plt.title("Tukey window")
>>> plt.ylabel("Amplitude")
>>> plt.xlabel("Sample")
>>> plt.ylim([0, 1.1])
>>> plt.figure()
>>> A = fft(window, 2048) / (len(window)/2.0)
>>> freq = np.linspace(-0.5, 0.5, len(A))
>>> response = 20 * np.log10(np.abs(fftshift(A / abs(A).max())))
>>> plt.plot(freq, response)
>>> plt.axis([-0.5, 0.5, -120, 0])
>>> plt.title("Frequency response of the Tukey window")
>>> plt.ylabel("Normalized magnitude [dB]")
>>> plt.xlabel("Normalized frequency [cycles per sample]")