scipy.stats.binned_statistic_dd
-
scipy.stats.binned_statistic_dd(sample, values, statistic='mean', bins=10, range=None, expand_binnumbers=False, binned_statistic_result=None)[source]¶ Compute a multidimensional binned statistic for a set of data.
This is a generalization of a histogramdd function. A histogram divides the space into bins, and returns the count of the number of points in each bin. This function allows the computation of the sum, mean, median, or other statistic of the values within each bin.
- Parameters
- samplearray_like
Data to histogram passed as a sequence of N arrays of length D, or as an (N,D) array.
- values(N,) array_like or list of (N,) array_like
The data on which the statistic will be computed. This must be the same shape as sample, or a list of sequences - each with the same shape as sample. If values is such a list, the statistic will be computed on each independently.
- statisticstring or callable, optional
The statistic to compute (default is ‘mean’). The following statistics are available:
‘mean’ : compute the mean of values for points within each bin. Empty bins will be represented by NaN.
‘median’ : compute the median of values for points within each bin. Empty bins will be represented by NaN.
‘count’ : compute the count of points within each bin. This is identical to an unweighted histogram. values array is not referenced.
‘sum’ : compute the sum of values for points within each bin. This is identical to a weighted histogram.
‘std’ : compute the standard deviation within each bin. This is implicitly calculated with ddof=0. If the number of values within a given bin is 0 or 1, the computed standard deviation value will be 0 for the bin.
‘min’ : compute the minimum of values for points within each bin. Empty bins will be represented by NaN.
‘max’ : compute the maximum of values for point within each bin. Empty bins will be represented by NaN.
function : a user-defined function which takes a 1D array of values, and outputs a single numerical statistic. This function will be called on the values in each bin. Empty bins will be represented by function([]), or NaN if this returns an error.
- binssequence or positive int, optional
The bin specification must be in one of the following forms:
A sequence of arrays describing the bin edges along each dimension.
The number of bins for each dimension (nx, ny, … = bins).
The number of bins for all dimensions (nx = ny = … = bins).
- rangesequence, optional
A sequence of lower and upper bin edges to be used if the edges are not given explicitly in bins. Defaults to the minimum and maximum values along each dimension.
- expand_binnumbersbool, optional
‘False’ (default): the returned binnumber is a shape (N,) array of linearized bin indices. ‘True’: the returned binnumber is ‘unraveled’ into a shape (D,N) ndarray, where each row gives the bin numbers in the corresponding dimension. See the binnumber returned value, and the Examples section of
binned_statistic_2d.- binned_statistic_resultbinnedStatisticddResult
Result of a previous call to the function in order to reuse bin edges and bin numbers with new values and/or a different statistic. To reuse bin numbers, expand_binnumbers must have been set to False (the default)
New in version 0.17.0.
- Returns
- statisticndarray, shape(nx1, nx2, nx3,…)
The values of the selected statistic in each two-dimensional bin.
- bin_edgeslist of ndarrays
A list of D arrays describing the (nxi + 1) bin edges for each dimension.
- binnumber(N,) array of ints or (D,N) ndarray of ints
This assigns to each element of sample an integer that represents the bin in which this observation falls. The representation depends on the expand_binnumbers argument. See Notes for details.
Notes
Binedges: All but the last (righthand-most) bin is half-open in each dimension. In other words, if bins is
[1, 2, 3, 4], then the first bin is[1, 2)(including 1, but excluding 2) and the second[2, 3). The last bin, however, is[3, 4], which includes 4.binnumber: This returned argument assigns to each element of sample an integer that represents the bin in which it belongs. The representation depends on the expand_binnumbers argument. If ‘False’ (default): The returned binnumber is a shape (N,) array of linearized indices mapping each element of sample to its corresponding bin (using row-major ordering). If ‘True’: The returned binnumber is a shape (D,N) ndarray where each row indicates bin placements for each dimension respectively. In each dimension, a binnumber of i means the corresponding value is between (bin_edges[D][i-1], bin_edges[D][i]), for each dimension ‘D’.
New in version 0.11.0.
Examples
>>> from scipy import stats
>>> import matplotlib.pyplot as plt
>>> from mpl_toolkits.mplot3d import Axes3D
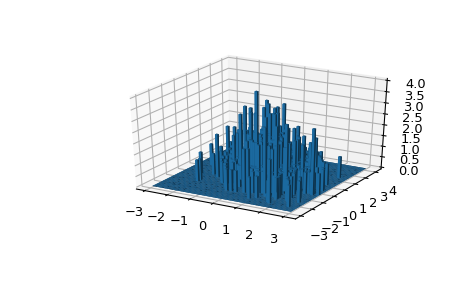
Take an array of 600 (x, y) coordinates as an example.
binned_statistic_ddcan handle arrays of higher dimension D. But a plot of dimension D+1 is required.>>> mu = np.array([0., 1.]) >>> sigma = np.array([[1., -0.5],[-0.5, 1.5]]) >>> multinormal = stats.multivariate_normal(mu, sigma) >>> data = multinormal.rvs(size=600, random_state=235412) >>> data.shape (600, 2)
Create bins and count how many arrays fall in each bin:
>>> N = 60
>>> x = np.linspace(-3, 3, N)
>>> y = np.linspace(-3, 4, N)
>>> ret = stats.binned_statistic_dd(data, np.arange(600), bins=[x, y],
...                                 statistic='count')
>>> bincounts = ret.statistic
Set the volume and the location of bars:
>>> dx = x[1] - x[0]
>>> dy = y[1] - y[0]
>>> x, y = np.meshgrid(x[:-1]+dx/2, y[:-1]+dy/2)
>>> z = 0
>>> bincounts = bincounts.ravel()
>>> x = x.ravel()
>>> y = y.ravel()
>>> fig = plt.figure()
>>> ax = fig.add_subplot(111, projection='3d')
>>> with np.errstate(divide='ignore'):   # silence random axes3d warning
...     ax.bar3d(x, y, z, dx, dy, bincounts)
Reuse bin numbers and bin edges with new values:
>>> ret2 = stats.binned_statistic_dd(data, -np.arange(600),
...                                  binned_statistic_result=ret,
...                                  statistic='mean')