scipy.signal.square
-
scipy.signal.square(t, duty=0.5)[source]¶ Return a periodic square-wave waveform.
The square wave has a period
2*pi, has value +1 from 0 to2*pi*dutyand -1 from2*pi*dutyto2*pi. duty must be in the interval [0,1].Note that this is not band-limited. It produces an infinite number of harmonics, which are aliased back and forth across the frequency spectrum.
- Parameters
- tarray_like
The input time array.
- dutyarray_like, optional
Duty cycle. Default is 0.5 (50% duty cycle). If an array, causes wave shape to change over time, and must be the same length as t.
- Returns
- yndarray
Output array containing the square waveform.
Examples
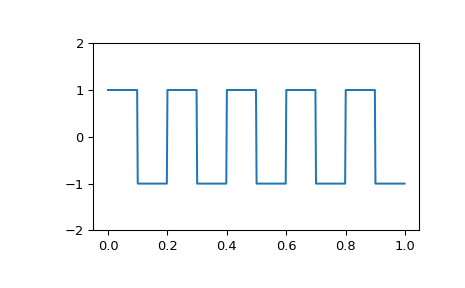
A 5 Hz waveform sampled at 500 Hz for 1 second:
>>> from scipy import signal
>>> import matplotlib.pyplot as plt
>>> t = np.linspace(0, 1, 500, endpoint=False)
>>> plt.plot(t, signal.square(2 * np.pi * 5 * t))
>>> plt.ylim(-2, 2)
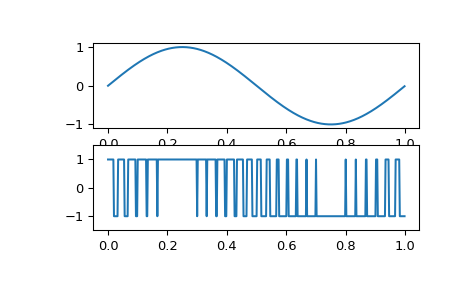
A pulse-width modulated sine wave:
>>> plt.figure()
>>> sig = np.sin(2 * np.pi * t)
>>> pwm = signal.square(2 * np.pi * 30 * t, duty=(sig + 1)/2)
>>> plt.subplot(2, 1, 1)
>>> plt.plot(t, sig)
>>> plt.subplot(2, 1, 2)
>>> plt.plot(t, pwm)
>>> plt.ylim(-1.5, 1.5)