scipy.stats.linregress
-
scipy.stats.linregress(x, y=None)[source]¶ Calculate a linear least-squares regression for two sets of measurements.
- Parameters
- x, yarray_like
Two sets of measurements. Both arrays should have the same length. If only x is given (and y=None), then it must be a two-dimensional array where one dimension has length 2. The two sets of measurements are then found by splitting the array along the length-2 dimension.
- Returns
- slopefloat
slope of the regression line
- interceptfloat
intercept of the regression line
- rvaluefloat
correlation coefficient
- pvaluefloat
two-sided p-value for a hypothesis test whose null hypothesis is that the slope is zero, using Wald Test with t-distribution of the test statistic.
- stderrfloat
Standard error of the estimated gradient.
See also
scipy.optimize.curve_fitUse non-linear least squares to fit a function to data.
scipy.optimize.leastsqMinimize the sum of squares of a set of equations.
Examples
>>> import matplotlib.pyplot as plt
>>> from scipy import stats
Generate some data:
>>> np.random.seed(12345678)
>>> x = np.random.random(10)
>>> y = 1.6*x + np.random.random(10)
Perform the linear regression:
>>> slope, intercept, r_value, p_value, std_err = stats.linregress(x, y)
>>> print("slope: %f    intercept: %f" % (slope, intercept))
slope: 1.944864    intercept: 0.268578
To get coefficient of determination (r_squared):
>>> print("r-squared: %f" % r_value**2)
r-squared: 0.735498
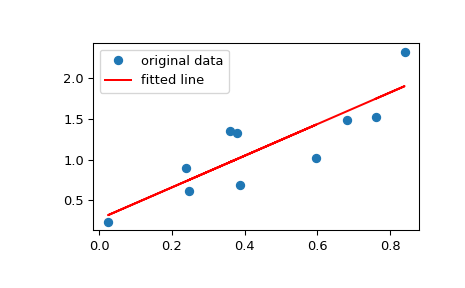
Plot the data along with the fitted line:
>>> plt.plot(x, y, 'o', label='original data')
>>> plt.plot(x, intercept + slope*x, 'r', label='fitted line')
>>> plt.legend()
>>> plt.show()