scipy.spatial.voronoi_plot_2d
-
scipy.spatial.voronoi_plot_2d(vor, ax=None, **kw)¶ Plot the given Voronoi diagram in 2-D
- Parameters
- vorscipy.spatial.Voronoi instance
Diagram to plot
- axmatplotlib.axes.Axes instance, optional
Axes to plot on
- show_points: bool, optional
Add the Voronoi points to the plot.
- show_verticesbool, optional
Add the Voronoi vertices to the plot.
- line_colorsstring, optional
Specifies the line color for polygon boundaries
- line_widthfloat, optional
Specifies the line width for polygon boundaries
- line_alpha: float, optional
Specifies the line alpha for polygon boundaries
- point_size: float, optional
Specifies the size of points
- Returns
- figmatplotlib.figure.Figure instance
Figure for the plot
See also
Notes
Requires Matplotlib.
Examples
Set of point:
>>> import matplotlib.pyplot as plt
>>> points = np.random.rand(10,2) #random
Voronoi diagram of the points:
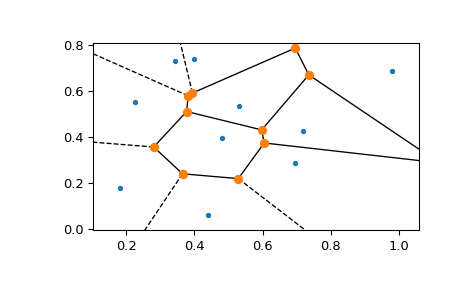
>>> from scipy.spatial import Voronoi, voronoi_plot_2d
>>> vor = Voronoi(points)
using
voronoi_plot_2dfor visualisation:>>> fig = voronoi_plot_2d(vor)
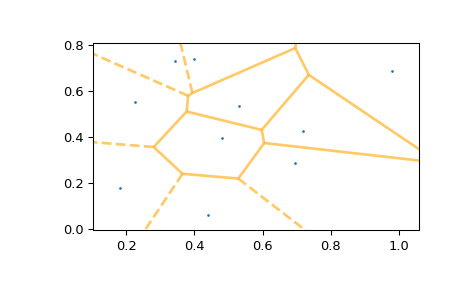
using
voronoi_plot_2dfor visualisation with enhancements:>>> fig = voronoi_plot_2d(vor, show_vertices=False, line_colors='orange', ... line_width=2, line_alpha=0.6, point_size=2) >>> plt.show()