scipy.ndimage.median_filter
-
scipy.ndimage.median_filter(input, size=None, footprint=None, output=None, mode='reflect', cval=0.0, origin=0)[source]¶ Calculate a multidimensional median filter.
Parameters: input : array_like
Input array to filter.
size : scalar or tuple, optional
See footprint, below
footprint : array, optional
Either size or footprint must be defined. size gives the shape that is taken from the input array, at every element position, to define the input to the filter function. footprint is a boolean array that specifies (implicitly) a shape, but also which of the elements within this shape will get passed to the filter function. Thus
size=(n,m)is equivalent tofootprint=np.ones((n,m)). We adjust size to the number of dimensions of the input array, so that, if the input array is shape (10,10,10), and size is 2, then the actual size used is (2,2,2).output : array, optional
The output parameter passes an array in which to store the filter output. Output array should have different name as compared to input array to avoid aliasing errors.
mode : {‘reflect’, ‘constant’, ‘nearest’, ‘mirror’, ‘wrap’}, optional
The mode parameter determines how the array borders are handled, where cval is the value when mode is equal to ‘constant’. Default is ‘reflect’
cval : scalar, optional
Value to fill past edges of input if mode is ‘constant’. Default is 0.0
origin : scalar, optional
The origin parameter controls the placement of the filter. Default 0.0.
Returns: median_filter : ndarray
Filtered array. Has the same shape as input.
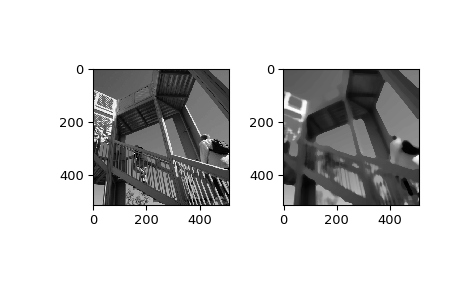
Examples
>>> from scipy import ndimage, misc
>>> import matplotlib.pyplot as plt
>>> fig = plt.figure()
>>> plt.gray()  # show the filtered result in grayscale
>>> ax1 = fig.add_subplot(121)  # left side
>>> ax2 = fig.add_subplot(122)  # right side
>>> ascent = misc.ascent()
>>> result = ndimage.median_filter(ascent, size=20)
>>> ax1.imshow(ascent)
>>> ax2.imshow(result)
>>> plt.show()