scipy.ndimage.gaussian_filter
- scipy.ndimage.gaussian_filter(input, sigma, order=0, output=None, mode='reflect', cval=0.0, truncate=4.0)[source]
Multidimensional Gaussian filter.
Parameters: input : array_like
Input array to filter.
sigma : scalar or sequence of scalars
Standard deviation for Gaussian kernel. The standard deviations of the Gaussian filter are given for each axis as a sequence, or as a single number, in which case it is equal for all axes.
order : {0, 1, 2, 3} or sequence from same set, optional
The order of the filter along each axis is given as a sequence of integers, or as a single number. An order of 0 corresponds to convolution with a Gaussian kernel. An order of 1, 2, or 3 corresponds to convolution with the first, second or third derivatives of a Gaussian. Higher order derivatives are not implemented
output : array, optional
The output parameter passes an array in which to store the filter output. Output array should have different name as compared to input array to avoid aliasing errors.
mode : str or sequence, optional
The mode parameter determines how the array borders are handled. Valid modes are {‘reflect’, ‘constant’, ‘nearest’, ‘mirror’, ‘wrap’}. cval is the value used when mode is equal to ‘constant’. A list of modes with length equal to the number of axes can be provided to specify different modes for different axes. Default is ‘reflect’
cval : scalar, optional
Value to fill past edges of input if mode is ‘constant’. Default is 0.0
truncate : float
Truncate the filter at this many standard deviations. Default is 4.0.
Returns: gaussian_filter : ndarray
Returned array of same shape as input.
Notes
The multidimensional filter is implemented as a sequence of one-dimensional convolution filters. The intermediate arrays are stored in the same data type as the output. Therefore, for output types with a limited precision, the results may be imprecise because intermediate results may be stored with insufficient precision.
Examples
>>> from scipy.ndimage import gaussian_filter
>>> a = np.arange(50, step=2).reshape((5,5))
>>> a
array([[ 0,  2,  4,  6,  8],
       [10, 12, 14, 16, 18],
       [20, 22, 24, 26, 28],
       [30, 32, 34, 36, 38],
       [40, 42, 44, 46, 48]])
>>> gaussian_filter(a, sigma=1)
array([[ 4,  6,  8,  9, 11],
       [10, 12, 14, 15, 17],
       [20, 22, 24, 25, 27],
       [29, 31, 33, 34, 36],
       [35, 37, 39, 40, 42]])
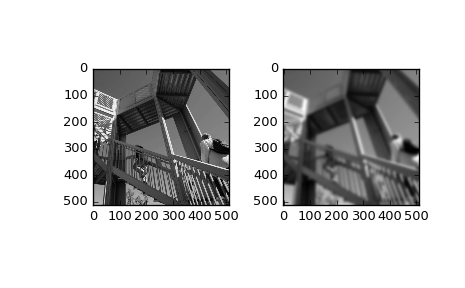
>>> from scipy import misc
>>> import matplotlib.pyplot as plt
>>> fig = plt.figure()
>>> plt.gray()  # show the filtered result in grayscale
>>> ax1 = fig.add_subplot(121)  # left side
>>> ax2 = fig.add_subplot(122)  # right side
>>> ascent = misc.ascent()
>>> result = gaussian_filter(ascent, sigma=5)
>>> ax1.imshow(ascent)
>>> ax2.imshow(result)
>>> plt.show()