scipy.spatial.Voronoi
- class scipy.spatial.Voronoi(points, furthest_site=False, incremental=False, qhull_options=None)
Voronoi diagrams in N dimensions.
New in version 0.12.0.
Parameters: points : ndarray of floats, shape (npoints, ndim)
Coordinates of points to construct a convex hull from
furthest_site : bool, optional
Whether to compute a furthest-site Voronoi diagram. Default: False
incremental : bool, optional
Allow adding new points incrementally. This takes up some additional resources.
qhull_options : str, optional
Additional options to pass to Qhull. See Qhull manual for details. (Default: “Qbb Qc Qz Qx” for ndim > 4 and “Qbb Qc Qz” otherwise. Incremental mode omits “Qz”.)
Raises: QhullError
Raised when Qhull encounters an error condition, such as geometrical degeneracy when options to resolve are not enabled.
ValueError
Raised if an incompatible array is given as input.
Notes
The Voronoi diagram is computed using the Qhull library.
Do not call the add_points method from a __del__ destructor.
Examples
Voronoi diagram for a set of point:
>>> points = np.array([[0, 0], [0, 1], [0, 2], [1, 0], [1, 1], [1, 2],
...                    [2, 0], [2, 1], [2, 2]])
>>> from scipy.spatial import Voronoi, voronoi_plot_2d
>>> vor = Voronoi(points)
Plot it:
>>> import matplotlib.pyplot as plt
>>> voronoi_plot_2d(vor)
>>> plt.show()
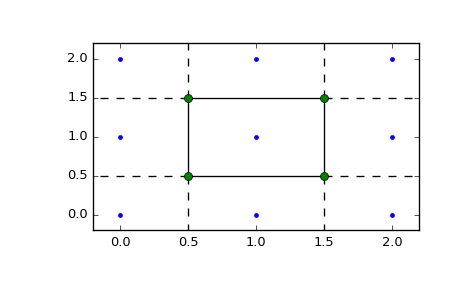
The Voronoi vertices:
>>> vor.vertices
array([[ 0.5,  0.5],
       [ 1.5,  0.5],
       [ 0.5,  1.5],
       [ 1.5,  1.5]])
There is a single finite Voronoi region, and four finite Voronoi ridges:
>>> vor.regions
[[], [-1, 0], [-1, 1], [1, -1, 0], [3, -1, 2], [-1, 3], [-1, 2], [3, 2, 0, 1], [2, -1, 0], [3, -1, 1]]
>>> vor.ridge_vertices
[[-1, 0], [-1, 0], [-1, 1], [-1, 1], [0, 1], [-1, 3], [-1, 2], [2, 3], [-1, 3], [-1, 2], [0, 2], [1, 3]]
The ridges are perpendicular between lines drawn between the following input points:
>>> vor.ridge_points
array([[0, 1],
       [0, 3],
       [6, 3],
       [6, 7],
       [3, 4],
       [5, 8],
       [5, 2],
       [5, 4],
       [8, 7],
       [2, 1],
       [4, 1],
       [4, 7]], dtype=int32)
Attributes
points (ndarray of double, shape (npoints, ndim)) Coordinates of input points. vertices (ndarray of double, shape (nvertices, ndim)) Coordinates of the Voronoi vertices. ridge_points (ndarray of ints, shape (nridges, 2)) Indices of the points between which each Voronoi ridge lies. ridge_vertices (list of list of ints, shape (nridges, *)) Indices of the Voronoi vertices forming each Voronoi ridge. regions (list of list of ints, shape (nregions, *)) Indices of the Voronoi vertices forming each Voronoi region. -1 indicates vertex outside the Voronoi diagram. point_region (list of ints, shape (npoints)) Index of the Voronoi region for each input point. If qhull option “Qc” was not specified, the list will contain -1 for points that are not associated with a Voronoi region. Methods
add_points(points[, restart]) Process a set of additional new points. close() Finish incremental processing.