scipy.interpolate.interp1d
- class scipy.interpolate.interp1d(x, y, kind='linear', axis=-1, copy=True, bounds_error=True, fill_value=nan, assume_sorted=False)[source]
Interpolate a 1-D function.
x and y are arrays of values used to approximate some function f: y = f(x). This class returns a function whose call method uses interpolation to find the value of new points.
Parameters: x : (N,) array_like
A 1-D array of real values.
y : (...,N,...) array_like
A N-D array of real values. The length of y along the interpolation axis must be equal to the length of x.
kind : str or int, optional
Specifies the kind of interpolation as a string (‘linear’, ‘nearest’, ‘zero’, ‘slinear’, ‘quadratic, ‘cubic’ where ‘slinear’, ‘quadratic’ and ‘cubic’ refer to a spline interpolation of first, second or third order) or as an integer specifying the order of the spline interpolator to use. Default is ‘linear’.
axis : int, optional
Specifies the axis of y along which to interpolate. Interpolation defaults to the last axis of y.
copy : bool, optional
If True, the class makes internal copies of x and y. If False, references to x and y are used. The default is to copy.
bounds_error : bool, optional
If True, a ValueError is raised any time interpolation is attempted on a value outside of the range of x (where extrapolation is necessary). If False, out of bounds values are assigned fill_value. By default, an error is raised.
fill_value : float, optional
If provided, then this value will be used to fill in for requested points outside of the data range. If not provided, then the default is NaN.
assume_sorted : bool, optional
If False, values of x can be in any order and they are sorted first. If True, x has to be an array of monotonically increasing values.
See also
- UnivariateSpline
- An object-oriented wrapper of the FITPACK routines.
- interp2d
- 2-D interpolation
Examples
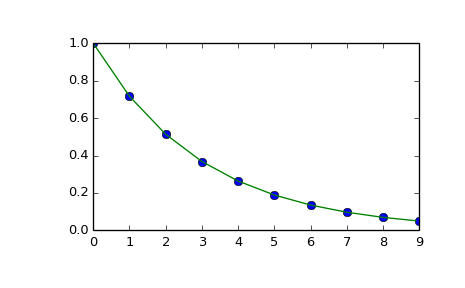
>>> import matplotlib.pyplot as plt
>>> from scipy import interpolate
>>> x = np.arange(0, 10)
>>> y = np.exp(-x/3.0)
>>> f = interpolate.interp1d(x, y)
>>> xnew = np.arange(0, 9, 0.1)
>>> ynew = f(xnew)   # use interpolation function returned by `interp1d`
>>> plt.plot(x, y, 'o', xnew, ynew, '-')
>>> plt.show()
Methods
__call__(x) Evaluate the interpolant :Parameters: x : array_like Points to evaluate the interpolant at.