scipy.stats.cosine
- scipy.stats.cosine = <scipy.stats._continuous_distns.cosine_gen object at 0x7f47583cf110>[source]
A cosine continuous random variable.
Continuous random variables are defined from a standard form and may require some shape parameters to complete its specification. Any optional keyword parameters can be passed to the methods of the RV object as given below:
Parameters: x : array_like
quantiles
q : array_like
lower or upper tail probability
loc : array_like, optional
location parameter (default=0)
scale : array_like, optional
scale parameter (default=1)
size : int or tuple of ints, optional
shape of random variates (default computed from input arguments )
moments : str, optional
composed of letters [‘mvsk’] specifying which moments to compute where ‘m’ = mean, ‘v’ = variance, ‘s’ = (Fisher’s) skew and ‘k’ = (Fisher’s) kurtosis. (default=’mv’)
Alternatively, the object may be called (as a function) to fix the shape,
location, and scale parameters returning a “frozen” continuous RV object:
rv = cosine(loc=0, scale=1)
- Frozen RV object with the same methods but holding the given shape, location, and scale fixed.
Notes
The cosine distribution is an approximation to the normal distribution. The probability density function for cosine is:
cosine.pdf(x) = 1/(2*pi) * (1+cos(x))
for -pi <= x <= pi.
Examples
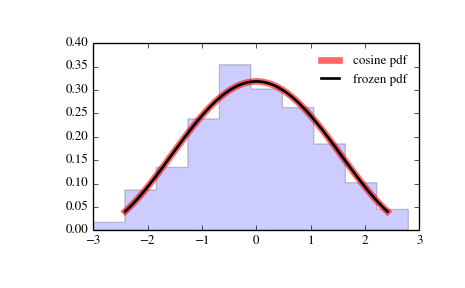
>>> from scipy.stats import cosine
>>> import matplotlib.pyplot as plt
>>> fig, ax = plt.subplots(1, 1)
Calculate a few first moments:
>>> mean, var, skew, kurt = cosine.stats(moments='mvsk')
Display the probability density function (pdf):
>>> x = np.linspace(cosine.ppf(0.01),
...               cosine.ppf(0.99), 100)
>>> ax.plot(x, cosine.pdf(x),
...          'r-', lw=5, alpha=0.6, label='cosine pdf')
Alternatively, freeze the distribution and display the frozen pdf:
>>> rv = cosine()
>>> ax.plot(x, rv.pdf(x), 'k-', lw=2, label='frozen pdf')
Check accuracy of cdf and ppf:
>>> vals = cosine.ppf([0.001, 0.5, 0.999])
>>> np.allclose([0.001, 0.5, 0.999], cosine.cdf(vals))
True
Generate random numbers:
>>> r = cosine.rvs(size=1000)
And compare the histogram:
>>> ax.hist(r, normed=True, histtype='stepfilled', alpha=0.2)
>>> ax.legend(loc='best', frameon=False)
>>> plt.show()
Methods
rvs(loc=0, scale=1, size=1) Random variates. pdf(x, loc=0, scale=1) Probability density function. logpdf(x, loc=0, scale=1) Log of the probability density function. cdf(x, loc=0, scale=1) Cumulative density function. logcdf(x, loc=0, scale=1) Log of the cumulative density function. sf(x, loc=0, scale=1) Survival function (1-cdf — sometimes more accurate). logsf(x, loc=0, scale=1) Log of the survival function. ppf(q, loc=0, scale=1) Percent point function (inverse of cdf — percentiles). isf(q, loc=0, scale=1) Inverse survival function (inverse of sf). moment(n, loc=0, scale=1) Non-central moment of order n stats(loc=0, scale=1, moments=’mv’) Mean(‘m’), variance(‘v’), skew(‘s’), and/or kurtosis(‘k’). entropy(loc=0, scale=1) (Differential) entropy of the RV. fit(data, loc=0, scale=1) Parameter estimates for generic data. expect(func, loc=0, scale=1, lb=None, ub=None, conditional=False, **kwds) Expected value of a function (of one argument) with respect to the distribution. median(loc=0, scale=1) Median of the distribution. mean(loc=0, scale=1) Mean of the distribution. var(loc=0, scale=1) Variance of the distribution. std(loc=0, scale=1) Standard deviation of the distribution. interval(alpha, loc=0, scale=1) Endpoints of the range that contains alpha percent of the distribution