numpy.arccos
-
numpy.arccos(x, /, out=None, *, where=True, casting='same_kind', order='K', dtype=None, subok=True[, signature, extobj]) = <ufunc 'arccos'>¶ Trigonometric inverse cosine, element-wise.
The inverse of
cosso that, ify = cos(x), thenx = arccos(y).Parameters: - x : array_like
x-coordinate on the unit circle. For real arguments, the domain is [-1, 1].
- out : ndarray, None, or tuple of ndarray and None, optional
A location into which the result is stored. If provided, it must have a shape that the inputs broadcast to. If not provided or None, a freshly-allocated array is returned. A tuple (possible only as a keyword argument) must have length equal to the number of outputs.
- where : array_like, optional
Values of True indicate to calculate the ufunc at that position, values of False indicate to leave the value in the output alone.
- **kwargs
For other keyword-only arguments, see the ufunc docs.
Returns: - angle : ndarray
The angle of the ray intersecting the unit circle at the given x-coordinate in radians [0, pi]. This is a scalar if x is a scalar.
Notes
arccosis a multivalued function: for each x there are infinitely many numbers z such that cos(z) = x. The convention is to return the angle z whose real part lies in [0, pi].For real-valued input data types,
arccosalways returns real output. For each value that cannot be expressed as a real number or infinity, it yieldsnanand sets the invalid floating point error flag.For complex-valued input,
arccosis a complex analytic function that has branch cuts [-inf, -1] and [1, inf] and is continuous from above on the former and from below on the latter.The inverse
cosis also known as acos or cos^-1.References
M. Abramowitz and I.A. Stegun, “Handbook of Mathematical Functions”, 10th printing, 1964, pp. 79. http://www.math.sfu.ca/~cbm/aands/
Examples
We expect the arccos of 1 to be 0, and of -1 to be pi:
>>> np.arccos([1, -1])
array([ 0.        ,  3.14159265])
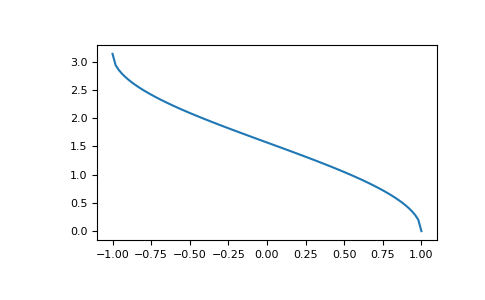
Plot arccos:
>>> import matplotlib.pyplot as plt
>>> x = np.linspace(-1, 1, num=100)
>>> plt.plot(x, np.arccos(x))
>>> plt.axis('tight')
>>> plt.show()