scipy.interpolate.pchip_interpolate#
- scipy.interpolate.pchip_interpolate(xi, yi, x, der=0, axis=0)[source]#
Convenience function for pchip interpolation.
xi and yi are arrays of values used to approximate some function f, with
yi = f(xi). The interpolant uses monotonic cubic splines to find the value of new points x and the derivatives there.See
scipy.interpolate.PchipInterpolatorfor details.- Parameters:
- xiarray_like
A sorted list of x-coordinates, of length N.
- yiarray_like
A 1-D array of real values. yi’s length along the interpolation axis must be equal to the length of xi. If N-D array, use axis parameter to select correct axis.
Deprecated since version 1.13.0: Complex data is deprecated and will raise an error in SciPy 1.15.0. If you are trying to use the real components of the passed array, use
np.realon yi.- xscalar or array_like
Of length M.
- derint or list, optional
Derivatives to extract. The 0th derivative can be included to return the function value.
- axisint, optional
Axis in the yi array corresponding to the x-coordinate values.
- Returns:
- yscalar or array_like
The result, of length R or length M or M by R.
See also
PchipInterpolatorPCHIP 1-D monotonic cubic interpolator.
Examples
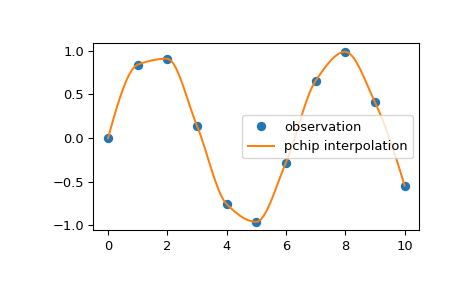
We can interpolate 2D observed data using pchip interpolation:
>>> import numpy as np
>>> import matplotlib.pyplot as plt
>>> from scipy.interpolate import pchip_interpolate
>>> x_observed = np.linspace(0.0, 10.0, 11)
>>> y_observed = np.sin(x_observed)
>>> x = np.linspace(min(x_observed), max(x_observed), num=100)
>>> y = pchip_interpolate(x_observed, y_observed, x)
>>> plt.plot(x_observed, y_observed, "o", label="observation")
>>> plt.plot(x, y, label="pchip interpolation")
>>> plt.legend()
>>> plt.show()