numpy.sinc#
- numpy.sinc(x)[source]#
Return the normalized sinc function.
The sinc function is equal to \(\sin(\pi x)/(\pi x)\) for any argument \(x\ne 0\).
sinc(0)takes the limit value 1, makingsincnot only everywhere continuous but also infinitely differentiable.Note
Note the normalization factor of
piused in the definition. This is the most commonly used definition in signal processing. Usesinc(x / np.pi)to obtain the unnormalized sinc function \(\sin(x)/x\) that is more common in mathematics.- Parameters:
- xndarray
Array (possibly multi-dimensional) of values for which to calculate
sinc(x).
- Returns:
- outndarray
sinc(x), which has the same shape as the input.
Notes
The name sinc is short for “sine cardinal” or “sinus cardinalis”.
The sinc function is used in various signal processing applications, including in anti-aliasing, in the construction of a Lanczos resampling filter, and in interpolation.
For bandlimited interpolation of discrete-time signals, the ideal interpolation kernel is proportional to the sinc function.
References
[1]Weisstein, Eric W. “Sinc Function.” From MathWorld–A Wolfram Web Resource. https://mathworld.wolfram.com/SincFunction.html
[2]Wikipedia, “Sinc function”, https://en.wikipedia.org/wiki/Sinc_function
Examples
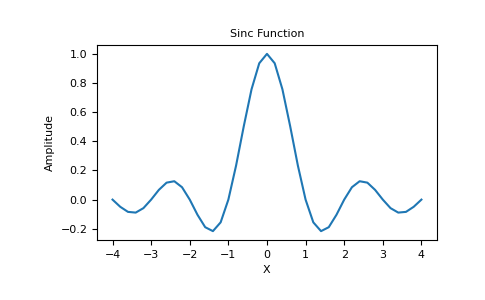
>>> import numpy as np
>>> import matplotlib.pyplot as plt
>>> x = np.linspace(-4, 4, 41)
>>> np.sinc(x)
 array([-3.89804309e-17,  -4.92362781e-02,  -8.40918587e-02, # may vary
        -8.90384387e-02,  -5.84680802e-02,   3.89804309e-17,
        6.68206631e-02,   1.16434881e-01,   1.26137788e-01,
        8.50444803e-02,  -3.89804309e-17,  -1.03943254e-01,
        -1.89206682e-01,  -2.16236208e-01,  -1.55914881e-01,
        3.89804309e-17,   2.33872321e-01,   5.04551152e-01,
        7.56826729e-01,   9.35489284e-01,   1.00000000e+00,
        9.35489284e-01,   7.56826729e-01,   5.04551152e-01,
        2.33872321e-01,   3.89804309e-17,  -1.55914881e-01,
       -2.16236208e-01,  -1.89206682e-01,  -1.03943254e-01,
       -3.89804309e-17,   8.50444803e-02,   1.26137788e-01,
        1.16434881e-01,   6.68206631e-02,   3.89804309e-17,
        -5.84680802e-02,  -8.90384387e-02,  -8.40918587e-02,
        -4.92362781e-02,  -3.89804309e-17])
>>> plt.plot(x, np.sinc(x))
[<matplotlib.lines.Line2D object at 0x...>]
>>> plt.title("Sinc Function")
Text(0.5, 1.0, 'Sinc Function')
>>> plt.ylabel("Amplitude")
Text(0, 0.5, 'Amplitude')
>>> plt.xlabel("X")
Text(0.5, 0, 'X')
>>> plt.show()