numpy.sinc
- numpy.sinc(x)
Return the sinc function.
The sinc function is
 .
.Parameters : x : ndarray
Array (possibly multi-dimensional) of values for which to to calculate sinc(x).
Returns : out : ndarray
sinc(x), which has the same shape as the input.
Notes
sinc(0) is the limit value 1.
The name sinc is short for “sine cardinal” or “sinus cardinalis”.
The sinc function is used in various signal processing applications, including in anti-aliasing, in the construction of a Lanczos resampling filter, and in interpolation.
For bandlimited interpolation of discrete-time signals, the ideal interpolation kernel is proportional to the sinc function.
References
[R259] Weisstein, Eric W. “Sinc Function.” From MathWorld–A Wolfram Web Resource. http://mathworld.wolfram.com/SincFunction.html [R260] Wikipedia, “Sinc function”, http://en.wikipedia.org/wiki/Sinc_function Examples
>>> x = np.arange(-20., 21.)/5.
>>> np.sinc(x)
array([ -3.89804309e-17,  -4.92362781e-02,  -8.40918587e-02,
        -8.90384387e-02,  -5.84680802e-02,   3.89804309e-17,
         6.68206631e-02,   1.16434881e-01,   1.26137788e-01,
         8.50444803e-02,  -3.89804309e-17,  -1.03943254e-01,
        -1.89206682e-01,  -2.16236208e-01,  -1.55914881e-01,
         3.89804309e-17,   2.33872321e-01,   5.04551152e-01,
         7.56826729e-01,   9.35489284e-01,   1.00000000e+00,
         9.35489284e-01,   7.56826729e-01,   5.04551152e-01,
         2.33872321e-01,   3.89804309e-17,  -1.55914881e-01,
        -2.16236208e-01,  -1.89206682e-01,  -1.03943254e-01,
        -3.89804309e-17,   8.50444803e-02,   1.26137788e-01,
         1.16434881e-01,   6.68206631e-02,   3.89804309e-17,
        -5.84680802e-02,  -8.90384387e-02,  -8.40918587e-02,
        -4.92362781e-02,  -3.89804309e-17])
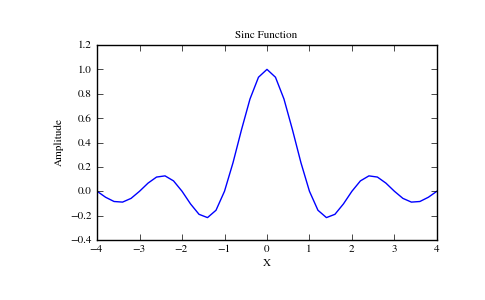
>>> import matplotlib.pyplot as plt
>>> plt.plot(x, np.sinc(x))
[<matplotlib.lines.Line2D object at 0x...>]
>>> plt.title("Sinc Function")
<matplotlib.text.Text object at 0x...>
>>> plt.ylabel("Amplitude")
<matplotlib.text.Text object at 0x...>
>>> plt.xlabel("X")
<matplotlib.text.Text object at 0x...>
>>> plt.show()
(Source code, png, pdf)

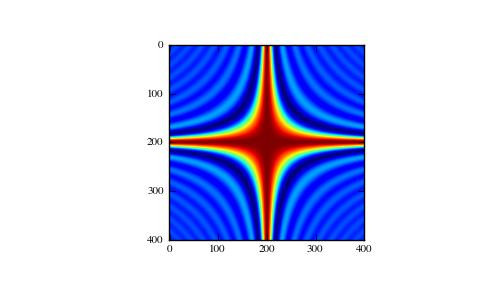
It works in 2-D as well:
>>> x = np.arange(-200., 201.)/50.
>>> xx = np.outer(x, x)
>>> plt.imshow(np.sinc(xx))
<matplotlib.image.AxesImage object at 0x...>
